Download
1 / 15
150 likes | 291 Views
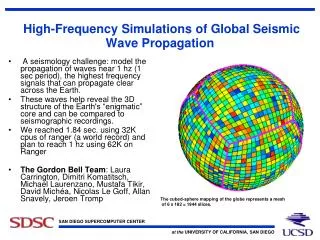
Simulations of the synchrotron frequency shift. A. Lasheen Acknowledgements : E. Shaposhnikova , T. Argyropoulos, H. Timko LIU-SPS BD WG Meeting 27/03/2014. Outline. Introduction Measurements Simulations Impedance model Quadrupolar frequency shift as a function of bunch length

E N D
Simulations of the synchrotron frequency shift A. Lasheen Acknowledgements : E. Shaposhnikova, T. Argyropoulos, H. Timko LIU-SPS BD WG Meeting 27/03/2014
Outline • Introduction • Measurements • Simulations • Impedance model • Quadrupolar frequency shift as a function of bunch length • Estimation of the missing imaginary impedance • Conclusion
Introduction Synchrotron frequency shift with intensity is used as a reference measurement of low frequency inductive impedance of the ring. Measurements in the past were able to show impedance reduction (2001) and then increase (2007) due to installation of MKE kickers. Following reduction is due to serigraphy of these kickers which can be seen in the latest measurements. These measurements are now used to verify the SPS impedance model and simulations are done to estimate the missing impedance. These measurements are complicated due to the strong dependance on the injected parameters which are not reproducible from one MD to another.
Method of measurement We inject bunches into the SPS with a mismatched (900kV) voltage to allow bunch to oscillate Bunch length is measured (Gaussian fit) during 10 oscillations (1500 turns) Injected bunch length and emittance should ideally be the same for the different intensities (which is not true in reality) The frequency of the oscillations depend on the intensity, and leads to a shift depending on the imaginary part of the impedance
Measurements - Example of injected bunch profile and fit Blue : measurement Green : Fit (bunch length ) Bunch profile
Measurements - Quadrupolaroscillations after injection for low intensity Intensity : Oscillation frequency : 322.34 Hz
Measurements - Quadrupolaroscillations after injection for high intensity Intensity : Oscillation frequency : 309.47 Hz
Summary of measurements for different injected emittances Reference measurements from 02/04/2013 and 28/01/2013(T. Argyropoulos - LIU-SPS BD WG meeting 07/02/2013) Oscillation frequencies wrt intensity and slope values for different emittances
Impedance model used in simulations Cavities Flanges BPMs Kickers Only resonators
Simulations: input distribution Example of parabolicbunchgeneration • Generation of a parabolic or Gaussian bunch (ESME) • In SPS RF system with voltage mismatched in respect to 900 kV • emittance variation (~bunch length)
Slopes as a function of bunch length Simulation code is HEADTAIL Parabolic (blue) and gaussian(magenta) bunch profiles We consider the average bunch length (after filamentation) Strong dependance on the bunch distribution Bunch length in measurement in different from real bunch length (++ for small bunches, up to 100ps in the LHC, information from T. Bohl)
Simulations – input distribution (2) Example of injection oscillations comparison Simulation Measurement Simulations of injection oscillations for low intensities with HEADTAIL Trying to find the closest distribution to what is extracted from the PS Comparison with the average of several measurements
Simulations – missing impedance estimation SPS impedance model SPS impedance + single broadband resonator
Simulations – missingimpedance estimation Adding a single broadband resonator
Conclusion • Work in progress • Impedance contributions to be added or improved • Cavities : travelling wave cavity model • Steps • Space charge • Resistive walls • Higher emittances to be analyzed : oscillations are very dependent on the input distribution