Download
1 / 7
70 likes | 172 Views
Learn to graph functions in a coordinate plane, input data using Excel, and graph using traditional methods and technology. Practice plotting coordinates, scatter plots, and connecting points with straight lines or curves. Explore graphing linear, polynomial, and higher-degree equations. Includes in-class and lab activities with a rubric assessment.

E N D
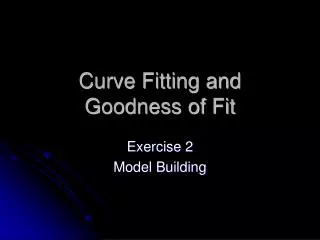
Curve Fitting and Goodness of Fit Exercise 1 Graphing Data OUTLINE
Objectives • Graph Functions in a Coordinate Plane • Input data using Excel • Graph using traditional methods • Graph using technology
Coordinate Plane • Coordinates • Plotting • Connecting Points
Plotting • Scatter Plot • Connect using straight line segments • Connect using curves
Graph Making • Conventional Methods • Freehand • Graph paper and straight edge • Technology • Excel
Graphing Equations • Linear • Polynomial • Second Degree • Third Degree • Fourth Degree • Fifth Degree
Skills Assessment • In-Class Activity • Lab Activity • Rubric