Download
1 / 34
350 likes | 378 Views
Discover how to define metropolitan areas in Europe based on global functions, not just population density. Learn about the 38 indicators used and the resulting 125 identified metropolitan regions. Explore the concentration of metropolitan functions and their impact on European territories. Follow the analysis of socio-economic structures within these metropolitan regions for a comprehensive review.

E N D
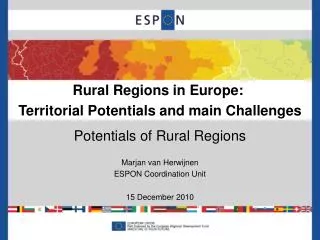
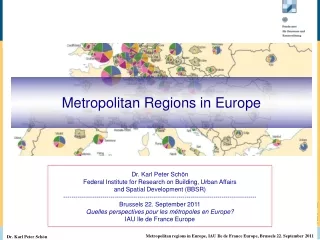
Metropolitan Regions in Europe Dr. Karl Peter Schön Federal Institute for Research on Building, Urban Affairs and Spatial Development (BBSR) ---------------------------------------------------------------------------------------------- Brussels 22. September 2011 Quelles perspectives pour les métropoles en Europe? IAU Ile de France Europe
How to identify metropolitan regions • The ‚classical‘ geographical approach: • Preselect administrative units with „urban“ characteristics • based on population size, density, or other morphological indicators • identify larger regional units (commuting areas, cont. build-up areas), • Then add indicators for metropolitan, international, global importance • And analyse to which degree urban areas are „metropolitan“, i.e. involved in global processes NUTS ? Does pop matter? Comparable data?
Alternative approach • Start from (global) functions rather than territorial units: • modern societies are organised in subsystems which are based on functional specialisation • five important subsystems are: politics, economy, science, transport, culture • All these subsystems are globalizing, following their own specific (spatial) patterns. • Where are global functions located?
Reversed approach • Instead of asking: • „Where in Europe are the most significant concentrations of population („urban areas“) and what „metropolitan“ characteristics do these areas have?“ • we asked: • „Where in Europe are the most significant concentrations of metropolitan functions and how do they constitute a European pattern of „metropolitan areas“?“
Index of metropolitan functions • 5 functional areas • Politics, Economy, Science, Transport, Culture • 16 group of indicators • 38 indicators • The 38 normalised indicators are additively combined to 16 groups of indicators, these to an index for each functional area, these again combined to a summary index of metropolitan function
Requirements for the indicators • All 38 indicators meet the following requirements: • Cover the whole European territory (CoE) • Standard definition for all countries • Reliable unofficial statistical data • Exact geocoding of all data (LAU-2 or exact coordinates)
LAU-2 locations with metropolitan function • About 120.000 LAU-2 units all across Europe form the territorial reference of the analysis • On a single indicator base, 8.480 units have any metropolitan function (= 7 %)
Concentration of metropolitan functions • Out of 120.000 LAU-2 units • 8.480 (=7%) have any metropolitan function • The top 480 (MFI > 1) represent 78% of all MF • The top 184 (MFI > 3) represent 63% of all MF • On a country base: • Germany = 16% • UK =12% • France = 10% • Italy = 8% • Spain = 6% • These 5 together: 52% • … and the Pentagon: ~ 50%
Concentration of metropolitan functions • MFI index points per 1 Mio population: • Luxembourg = 55 • Switzerland =17 • Sweden = 14 • Belgium = 12 • Norway = 12 • Denmark, Austria, Netherlands = 10 (each)
Regionalisation by density functions • Metropolitan regions are constructed through GIS methods using density functions and travel time isochrones • Based on 60 minutes travel time by car 125 metropolitan regions can be identified.
Some characteristics • These resulting 125 metropolitan regions • Account for 10% of the total area • Concentrate 50% of Europe‘s population (=350 mio inh.) • And 65% of Europe‘s GDP (=8.500 bn €) • And 80% of all metropolitan functions
Next steps • Analyse NUTS3 – MR overlays • Estimate statistical data for MR units • Analyse structures and trends of socio-economic characteristics for metropolitan regions
http://www.bbsr.bund.de/cln_032/nn_147528/BBSR/EN/Publications/OnlinePublications/2011/ON012011.htmlhttp://www.bbsr.bund.de/cln_032/nn_147528/BBSR/EN/Publications/OnlinePublications/2011/ON012011.html