Download
1 / 11
110 likes | 193 Views
Explore the impact of water trends on agricultural economics and rural communities, including challenges and opportunities for farmers. Learn about innovative water management approaches to sustain agriculture.

E N D
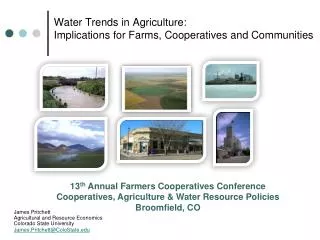
James Pritchett Agricultural and Resource Economics Colorado State University James.Pritchett@ColoState.edu Water Trends in Agriculture:Implications for Farms, Cooperatives and Communities 13th Annual Farmers Cooperatives Conference Cooperatives, Agriculture & Water Resource Policies Broomfield, CO
Overview Slide • Farm Economics: • What does limited water mean to the farm business? • Regional Economics: • What does irrigated agriculture mean to rural communities?
Reductions in Irrigated Ag • Urbanization • Declining Aquifers • Institutions
Profit and Water: General Manager Approach Reduced Water Challenges Reduced Water Opportunities Opportunistic Farming System Approaches “Spreading” Water Time Specific Management Transition to Perennials Technology Adoption Water as a Crop $ per ac. • Scale of Operation • Turns (asset efficiency) • Earns (cost efficiency) • Financial Limitations • Cash Flow • Balance Sheet • Operational Risk 25inches AvailableWater
Irrigated Ag in Colorado 2007 Colorado Agriculture Receipts: $6.3 billion 2007 Colorado Crop Receipts: $2.0 billion 2007 Irrigated Crops Receipts: $1.4 billion (estimated)
Economic Activity per Acre aIncludes all production agriculture.
Economic Activity: Irrigated Agriculture • DirectActivity • Crop Sales (Gross Revenues) • Indirect Effects • Fertilizer, Seed, Chemical Sales (but margins only) • Transportation • Real Estate Services • Ag Consultants • Induced Effects • Wages Spent with Local Businesses • When is generated economic activity high? • High value crops sold outside the region. • Revenues spent on locally produced inputs. • Local support industries use local labor and inputs.
Innovative Approaches • Farm Conservation of CU • Deficit Irrigation and Dryland Rotation • Innovative Institutions • Water Cooperative • ‘Super Ditch’ • Shared Infrastructure and Institutions • ‘One Stop Shopping’ for Projects • Economic Development Zones • Water Basin Approaches
Water in Agriculture: Where to go from here? • Irrigated agriculture is an engine of economic activity. • Income is largest for exported goods, local input use. • If acres transition, what alternatives exist? • What investments might be created? • Water Transfers Might Take Many Forms • Buy Back Leasing, Interruptible Supply • Shared Infrastructure and Institutions • Continued Support for Flexibility • Encouraging ‘Good’ Transfers