Linkage
Linkage. chromosome theory of inheritance. Mendelian genes have specific loci (positions) on chromosomes Chromosomes undergo segregation and independent assortment during meiosis. Figure 12.2. /. /. /. /. 1. 1. 1. 1. 4. 4. 4. 4. P Generation. Yellow-round seeds ( YYRR ).

Linkage
E N D
Presentation Transcript
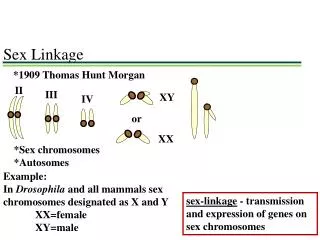
chromosome theory of inheritance • Mendelian genes have specific loci (positions) on chromosomes • Chromosomes undergo segregation and independent assortment during meiosis
Figure 12.2 / / / / 1 1 1 1 4 4 4 4 P Generation Yellow-round seeds (YYRR) Green-wrinkled seeds (yyrr) y Y r R r R Y y Meiosis Fertilization r y R Y Gametes All F1 plants produce yellow-round seeds (YyRr). F1 Generation R R y y r r Y Y Meiosis LAW OF SEGREGATION The two alleles for each gene separate. LAW OF INDEPENDENT ASSORTMENT Alleles of genes on nonhomologous chromosomes assort independently. r r R R Metaphase I y Y Y y 1 1 r r R R Anaphase I Y Y y y Metaphase II r R R r 2 2 y Y y Y y Y Y y Y y y Y r R R r r r R R yr yR Yr YR YR F2 Generation An F1 F1 cross-fertilization 3 3 Fertilization results in the 9:3:3:1 phenotypic ratio in the F2 generation. Fertilization recombines the R and r alleles at random. 9 : 3 : 3 : 1
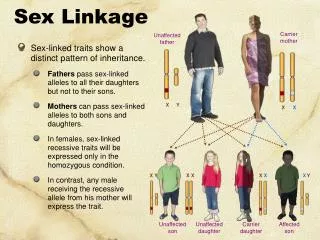
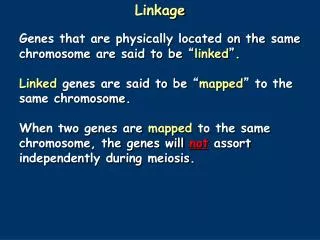
linked genes • Genes located on the same chromosome that tend to be inherited together • Do not independently assort
What would be the expected phenotypic ratio assuming independent assortment? GgLl ggll
What statistic would you use to verify that your observed values differed from your expected values?What would be the expected values?Hmm…not 1:1:1:1;more like 1:1
Most look like parents, but some are recombinants due to crossing over
% Recombinant Frequency or = # map units apart two genes are
You try… • What is the frequency of recombinants?How many map units apart are the two genes? • 500 offspring • 7 grey short recombinants • 8 black long recombinants
linkage map • a genetic map of a chromosome based on recombination frequencies • the farther apart two genes are, the higher the probability that a crossover will occur between them • therefore the higher the recombination frequency
You try… • Flies can have black bodies (b), vestigial wings (vg), and cinnabar eyes (cn). • The cross-over frequencies are listed below: • b-cn 7.5% • b-vg 17% • vg-cn 9.5% • Draw the chromosome map. Label the distance btw the genes.