Download
1 / 35
390 likes | 733 Views
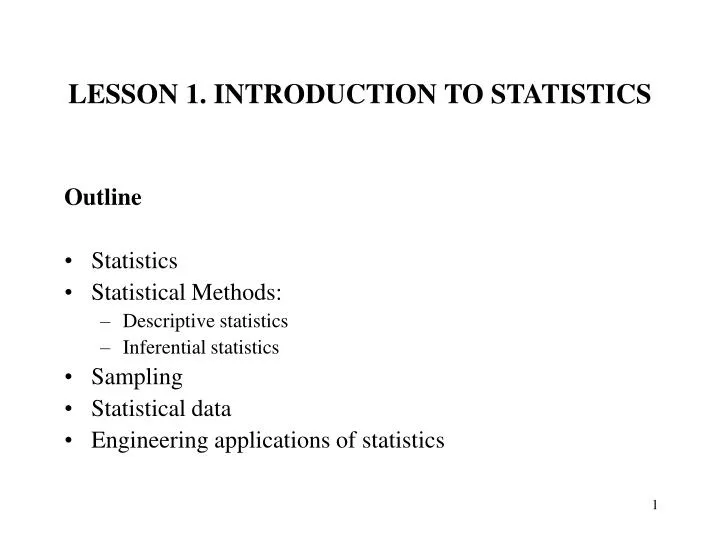
LESSON 1. INTRODUCTION TO STATISTICS. Outline Statistics Statistical Methods: Descriptive statistics Inferential statistics Sampling Statistical data Engineering applications of statistics. Statistics.

E N D
LESSON 1. INTRODUCTION TO STATISTICS Outline • Statistics • Statistical Methods: • Descriptive statistics • Inferential statistics • Sampling • Statistical data • Engineering applications of statistics
Statistics Statisticsisthe body of techniques used to facilitate the collection, organization, presentation, analysis, and interpretation of data for the purpose of making better decisions.
Necessity of Statistics Everything changes. For example, if you are using a stamping process to make a cover for motor housing not every part will be identical 100% of the time. Knowledge of when (and why) the cover does not meet specifications is necessary. The stamping die will wear out, there may be differences in the metal being stamped, die pressure may fluctuate. We can describe the fluctuations in quality of the cover using statistics.
Necessity of Statistics • Engineers deal with situations that are poorly defined or must make decisions using data that are not precise. Proper application of statistical analyses may help the engineer deal with these situations. Optimization of a process or product or the design of a device requires that both performance and production specifications be met. Engineers need to know how to describe, monitor, and characterize their work and statistics provides the means.
Necessity of Statistics In this course, we will know the basics of how to examine data and how to design experiments. Engineering statistics courses traditionally cover data analyses. The approach focuses on methods and not theory by providing practical examples.
Statistical Methods Statistical Methods Descriptive Inferential Statistics Statistics
Descriptive Statistics • EXAMPLE 1: A survey conducted by the Financial Post Magazine found that 50.08% of the people wanted to vote “no” in the past Quebec referendum. The statistic 50.08% describes the proportion of voters who wanted to stay in Canada. • EXAMPLE 2: According to Consumer Reports, Whirlpool washing machine owners reported 9 problems per 100 machines during a year. The statistic 9 describes the number of problems out of every 100 machines.
Descriptive Statistics • Wesbster’s New Collegiate Dictionary has the following definitions • Describe – to represent by a figure, model, or picture • Statistics – a branch of mathematics dealing with the collection, analysis, interpretation, presentation of masses of numerical data. • Descriptive statistics are the tabular, graphical, and numerical methods used to summarize data.
Descriptive Statistics • Involves • Collecting data • Organizing or summarizing data • Presenting data • Purpose • Describe the situation
Example: Hudson Auto Repair The manager of Hudson Auto would like to have a better understanding of the cost of parts used in the engine tune-ups performed in the shop. She examines 50 customer invoices for tune-ups. The costs of parts, rounded to the nearest dollar, are listed below. What would you do?
Example: Hudson Auto Repair Tabular & Graphical • Tabular Summary (Frequencies and Percent Frequencies Parts Percent Cost ($)FrequencyFrequency 50-59 2 4 60-69 13 26 70-79 16 32 80-89 7 14 90-99 7 14 100-109 510 Total 50 100
Example: Hudson Auto Repair Tabular & Graphical 18 • Graphical Summary (Histogram) 16 14 12 Frequency 10 8 6 4 2 Parts Cost ($) 50 60 70 80 90 100
Example: Hudson Auto Repair Numerical • Numerical Descriptive Statistics • The most common numerical descriptive statistic is the average (or mean). • Hudson’s average cost of parts, based on the 50 tune-ups studied, is $79 (found by summing the 50 cost values and then dividing by 50).
Inferential Statistics • Webster’s New Collegiate Dictionary • Infer – to derive as a conclusion from facts of premises. • Inference – the act of passing from statistical sample data to generalizations. • Statistics – a branch of mathematics dealing with the collection, analysis, interpretation, presentation of masses of numerical data. • Statistical inference is the process of using data obtained from a small group of elements (the sample) to make estimates and test hypotheses about the characteristics of a larger group of elements (the population).
Inferential Statistics • EXAMPLE 1: Fuel efficiency of a make and model is determined by sampling a few cars. • EXAMPLE 2: The time required by a robot to do a repetitive task must is determined by a few sample observation. • EXAMPLE 3: Strength of steel must is determined by a laboratory experiment.
Involves Estimation Hypothesis testing Purpose Draw conclusions or inferences about population characteristics Inferential Statistics Population?
Sampling • Population (universe) • The set of all items of interest • The word population does not necessarily refer to a group of people. • In case of Hudson Auto population refer to the set of all engine tune-ups. • Sample • A set of data drawn (or observed) from the population • In case of Hudson Auto sample refers to the set of 50 tune-ups examined
Sampling • Parameter • Summary measure about population • Usually unknown or known from some published sources • In case of Hudson Auto a parameter is the average cost of parts used in all engine tune-ups. • Statistic • Summary measure about sample • Obtained from the sample • In case of Hudson Auto a statistic is the average cost, $79 of parts used in 50 engine tune-ups examined.
Sampling • Deductive Statistics • Deduces properties of samples from a complete knowledge about population characteristics • Inductive Statistics • Concerned with using known sample information to draw conclusions, or make inferences regarding the unknown population • Same as inferential statistics
Example: Hudson Auto Repair 1. Population consists of all tune-ups. Average cost of parts is unknown. • Process of Statistical Inference 2. A sample of 50 engine tune-ups is examined. 3. The sample data provide a sample average cost of $79 per tune-up. 4. The value of the sample average is used to make an estimate of the population average.
Necessity of Sampling • Economic advantages of samples- Inspecting a portion of items being produced is obviously cheaper than assessing the entire run in detail
Necessity of Sampling • Timeliness- It could take years to poll potential users of a product regarding their design preferences, by which time the item will probably have become obsolete. Sample opinion data must be obtained for such an investigation
Necessity of Sampling • Large Population- Imagine the problems faced by a food processor if the contents of each of the thousands of cans filled in one day were separately weighed.
Necessity of Sampling • Destructive Nature of the Observation- A large class of statistical investigations involves observations that destroy the units observed. • Especially in engineering, test units must be damaged or destroyed to determine strength, durability, or lifetime. • We won’t burn our all the light bulbs to find out what proportion were defective
Necessity of Sampling • Inaccessible Populations- Statisticians often measure population that may never actually exist. • Consider the automotive engineer wishing to measure carbon deposits on valves of six cylinder engines. • Only engines from cars acquired by the researcher’s firm would be available for disassembly
Statistical Data • Qualitative data • involves attributes, such as sex, occupation, location or some other category • Quantitative data • represents the quantity or amount of something, such as length (in Centimeters), weight (in kilograms) etc.
Statistical Data • Quantitative data • Nominal data represents arbitrary codes. • Course numbers 73-331, 73-320 • Ordinal data convey ranking in terms of importance, strength or severity • e.g., 80 excellent, 70 good, 60 fair • Interval data allow only addition or subtraction • e.g., temperature • Ratio data allow all arithmetic operations • e.g., size, weight, strength
Statistical Data • Nominal data • Data that can only be classified into categories and cannot be arranged in an ordering scheme. • Examples: eye color, gender, marital status, religious affiliation, etc. • Examples: Suppose that the responses to the marital-status question is recorded as follows: Single 1 Divorced 3 Married 2 Widowed 4
Statistical Data • Ordinal data • Data or categories that can be ranked; that is, one category is higher than another. However, numerical differences between data values cannot be determined. • Examples: Maclean’s ranking (medical doctoral); 1. University of Toronto 2. University of British Columbia 3. Queen’s university • Examples: Opinion survey: Excellent 4 Fair 2 Good 3 Poor 1
Statistical Data • Interval data • The distance between numbers is a known, constant size, but the zero value is arbitrary. • Examples: Temperature on the Fahrenheit scale. • Ratio data • Data possessing a natural zero point and organized into measures for which differences are meaningful. • Examples: Money, income, sales, profits, losses, heights of NBA players
Statistical Data • Discrete • Assume values that can be counted. • Example: Number of defective items, number of customers arrive in a bank • Continuous • Can assume all values between any two specific values. They are obtained by measuring. • Example: length, weight, volume
Statistical Data • Cross-sectional data • Observations are measured at the same time • Examples: Marketing surveys and political opinion polls • Time-series data • Observations are measured at successive points in time • Examples: Monthly sales data, daily temperature data
Engineering Applications of Statistics • Statistical process Control • Quality assessment • Model Building and Predicting • Communicating with and Acting on experimental results • Assessing Design Reliability • Experimental design • Simulation
READING AND EXERCISES Lesson 1 Reading: Section 1-1 to 1-4, pp. 1-14 Exercises: 1-5, 1-8, 1-9, 1-12