Download
1 / 17
170 likes | 273 Views
Learn how photogrammetry creates DEMs & orthophotos from images, including principles, synthetic vs. actual data, processing steps, and precision assessment.

E N D
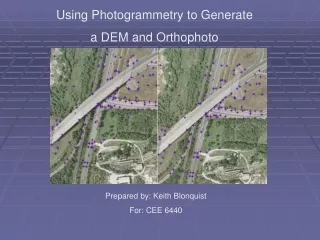
Using Photogrammetry to Generate a DEM and Orthophoto Prepared by: Keith Blonquist For: CEE 6440
What is photogrammetry? **Photogrammetry is the science of using images to obtain information about physical objects **Geometrical aspects of photogrammetry (recovery of 3D geometry) What is photogrammetry used for? **Photogrammetry is used extensively to collect data for GIS databases **Photogrammetry involves aerial images, satellite images, etc… **Most GIS databases contain data-sets that were collected using photogrammetry What does this presentation cover? **Generation of a various DEMs and an orthophoto from aerial images **This will be demonstrated with both a synthetic and actual data-set
Principles of photogrammetry Perspective projection: from 3D to 2D Collinearity equations: express 2D image coordinates (x, y) as a function of the 3D coordinates (X, Y, Z) and camera orientations Multiple images: a point must be visible in 2 separate images in order to find its 3D coordinate Bundle Triangulation (based on collinearity equations) simultaneously solves for camera orientations and (X, Y, Z) coordinates of target points from image coordinates (x, y) of point correspondences
Synthetic Data-set Synthetic terrain Synthetic images Point correspondences are corresponding points located in several images
Resulting 3D points from Bundle Triangulation (in an arbitrary coordinate system) Using ground control points to orient model to known coordinate system Ground Control points are points for which the (X, Y, Z) coordinates are known in the desired coordinate system
Import 3D points and polygons to ArcGIS Points interpolated to TIN (points on tops of house were clipped out) Triangulation done by Delaunay triangulation—you can specify break lines if you wish TIN converted to raster
Elevation Interpolations Kriging Inverse Distance Weighting Splines (points on tops of houses were clipped out)
Orthophoto vs. Actual Image Orthophotos are a result of parallel projection Actual images are a result of perspective projection Actual image vs. Orthophoto
Actual Dataset Images taken with a Wild RC30 aerial camera. Krawietz Aerial Photography, San Antonio, TX
Selection of Point Correspondences ***This collection of point correspondences is fairly sparse—so the resulting DEMs will not be as accurate as possible. More accurate models result from more dense point collection. In practice, automatic point correlation or use of stereo plotters can be used to more densely collect points.
Resulting points 3D point cloud from Bundle Triangulation in arbitrary coordinate system Orientation from ground control points Coordinates of control points in North American Datum 1983, Texas State Plane Coordinate System, South Central Zone North American Vertical Datum of 1988 in U.S. Survey Feet ID X Y Z 1001 2148855.267 13750393.210 781.523 1002 2147642.219 13748882.528 760.457 1003 2149799.024 13749852.479 746.416 1004 2148318.001 13748247.835 731.077
Precision of Solution: **Bundle Triangulation Algorithm gives error estimates of points in 3D space **For these two images the 1-sigma error in 3D space was 0.43 ft (13 cm) **This means that there is a 68% probability that the calculated points are within 0.43 ft (13 cm) of the actual points, and a 95% probability that the calculated points are within 0.86 ft (26 cm) of the actual points **A higher number of points can increase this precision (more accurate camera positions are calculated) **More accurate camera models can also provide higher precision (these calculations did not involve corrections for lens distortion) **RMSE for transform to Texas State Plane Coordinate System = 0.73 ft (22 cm)
Import point and polygon files to ArcGIS One point file, one polyline file (break lines) and one polygon file (bridge)
Splines IDW Kriging
Summary: **Photogrammetry can be used to generate accurate DEMs and Orthophotos **Accuracy and detail of models is highly dependent upon the number of point correspondences that are chosen **Some features (houses, bridges) can be problematic Work still to be completed: **Still need to generate an orthophoto from the actual images