Download
1 / 34
340 likes | 480 Views
ArcGIS in 6 Easy Pieces. Jennifer J. Lund Wheaton College September 2008 Link to this presentation : http://fileserver.wheatonma.edu/lund_jenni/GIS/GIS6EasyPieces_PPT.ppt Link to the documentation for the Six Easy Pieces Link to the details on the Sixth not-so-easy Piece.

E N D
ArcGIS in 6 Easy Pieces Jennifer J. Lund Wheaton College September 2008 Link to this presentation: http://fileserver.wheatonma.edu/lund_jenni/GIS/GIS6EasyPieces_PPT.ppt Link to the documentation for the Six Easy Pieces Link to the details on the Sixth not-so-easy Piece
Does this need to be so hard?!! Not if I stick to simple maps
The Six Things • Navigate the interactive map • Add map-ready data • Change how the data is displayed • Share your map • Make subsets for analysis • “Join” data tables to a base map
Navigate the interactive map Add map-ready data Change how the data is displayed Share your map Make subsets for analysis “Join” data tables to a base map The Six Things
BTW …. What is a shape file? • Technically: a single .SHP file • Conveniently: A family of files associated with an SHP file. • Colloquially: A layer in ArcMap
The Six Things Navigate the interactive map Add map-ready data Change how the data is displayed Share your map Make subsets for analysis “Join” data tables to a base map
3. Change how the data is displayed:Making it pretty, and easy to read
3. Change how the data is displayed:Switch to a different data column
3. Change how the data is displayed:Switch to a different data column
3. Change how the data is displayed:Get the software to do some math • Arithmetic representation of data, for example: =
Navigate the interactive map Add map-ready data Change how the data is displayed Share your map Make subsets for analysis “Join” data tables to a base map The Six Things
4. Save and share your map • To save & share an image • Take a screenshot • Paste it into PowerPoint or Word • To share the fully-functional interactive map • Zip and share the folder
Insider’s Tip:Know what you are saving • File / Savesaves the MXD file.MXD points to data. • You need to share the data, too. • Safest approach:Keep everything in a single folder.Zip and share the entire folder.
Navigate the interactive map Add map-ready data Change how the data is displayed Share your map Make subsets for analysis “Join” data tables to a base map The Six Things
5. “Select” subsets for analysisSelected by the nature of the data e.g. “Parishes with more than 50% Black or African American”
5. “Select” subsets for analysisSelect by location • For example: • Within a parish • Within 500 yards of a school • Intersected by an interstate
Navigate the interactive map Add map-ready data Change how the data is displayed Share your map Make subsets for analysis “Join” data tables to a base map The Six Things
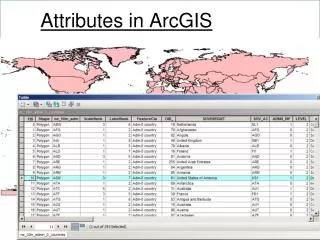
6. Link data tables to a base map • Format the table properly • Do some magic with ArcCatalog • Drag the table into ArcMap • Link the data table to the map
Navigate the interactive map Add map-ready data Change how the data is displayed Share your map Make subsets for analysis “Join” data tables to a base map The Six Things
Suggestions for Skill #7 • Add XY data (think GPS!) • Geocode street addresses Easy with www.batchgeocode.com • Rubber sheeting: To use a paper map as a background image • Add points or lines:Pointing, clicking, drawing
What are coordinate system & projections?Coordinate systems & projections put a round globe onto a flat screen What do you need to know? That they exist and they are important How to recognize a projection problem How to look for the projection information: That a Re-Project Wizard exists in the Toolbox Coping with Projections
Geography and cartography are traditional, well-respected fields of academic science and professional achievement. Maps are powerful tools that can be misused. Expect criticism
Learning benefits of simple mapping • Spatial literacy (location is important) • Data literacy (with compelling issues) • Quantitative literacy (with sensory input, not numerals
Pareto Principle: 80% of the job requires only 20% of the knowledge. Work to be done Knowledge required
Sizing down, not Dumbing down Lund Corollary: 20% of the job requires 5% of the knowledge. Work to be done Knowledge required