Download
1 / 26
260 likes | 377 Views
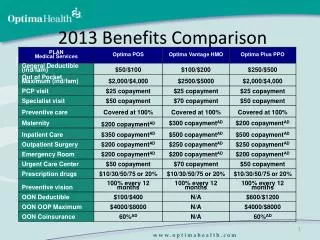
This presentation details the 2013 operating budget for faculty and staff compensation, totaling $135.7 million, with $77.1 million allocated for personnel costs. It outlines benefits such as health, dental, and life insurance, along with valuable programs like tuition assistance and fitness memberships. The focus on competitive healthcare premiums, which show a 0% increase for Anthem rates in 2013, underscores the institution's commitment to employee wellness. The document includes comparisons of benefits across different employee categories and insights into retirement system rates and projections.

E N D
2013 Benefits Briefing Presentation to Board of Regents November 15, 2012
2012-2013Operating Budget • Total Operating Budget $135,700,000 • Total Personnel Budget (56.8%) $77,091,204 Note: Personnel Budget includes all salaries & fringe benefits
Types of Benefits • Health Insurance • Dental Insurance • Life Insurance • Vacation Days • Holidays • Sick Leave • Tuition Assistance • Fitness Center Membership • Retirement: • KTRS • KERS • ORP • FICA • Medicare • Social Security • Workers Compensation • Unemployment Insurance
3 Categories of Employees • Hourly employee working 8 hours per day at $12.19 per hour ($25,355 annually) • Mid-level exempt professional employee with $50,000 annual salary • Senior level employee with $103,259 annual salary
Healthcare 2013 • Strategy • Provide the best competitive healthcare for the lowest premium/cost • Accomplish this by involving all employees and dependents in becoming healthier, improving their lives and therefore reducing claims & premiums • Focus incentives on continually improving results
Healthcare 2013 • 0% increase in Anthem rates for 2013 • Continues a desired trend in rates indicating positive effect of wellness. MSU annual increases National Trend • 8.17% increase 2008 9.4% • 6.23% increase 2009 9.2% • 7.00% increase 2010 9.0% • 4.36% increase 2011 9.0% • 0% for 2012 8.5% • 0% for 2013 7.0% est.
Healthcare 2012/13 Annual Premiums • 2012 total actual premium $7,166,965 and HRA $792,400. • 2012 actual annual University premium including $792,400 HRA, $5,518,563
Workers Compensation • Remain fully insured with KEMI (Kentucky Employers’ Mutual Insurance) • 14.5% further reduction in premium for 2013 • 2013 Premium $208,668 • 2012 premium $243,973 • 2011 premium $255,233 • 2010 premium $317,715 • 2009 premium $746,340
Retirement System Employer Rates with Projections Actual Projected