Download
1 / 33
400 likes | 772 Views
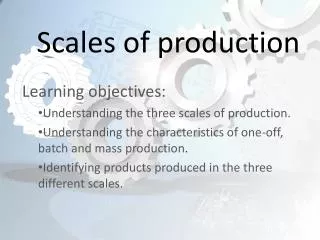
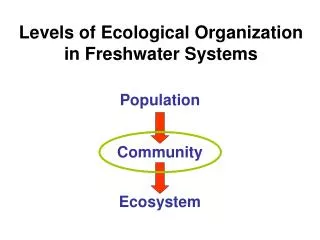
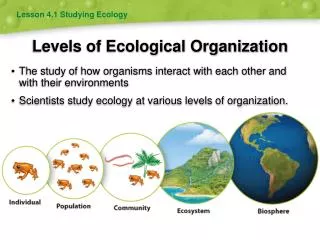
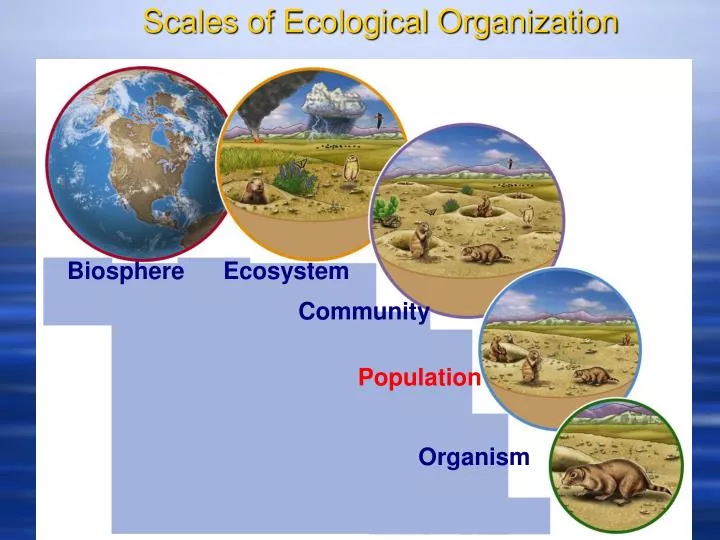
Scales of Ecological Organization. Biosphere. Ecosystem. Community. Population. Organism. Definition. Population ecology is the study of births, deaths, and the dynamics forces which regulate the number of individuals in a population. Density and Dispersion. Density

E N D
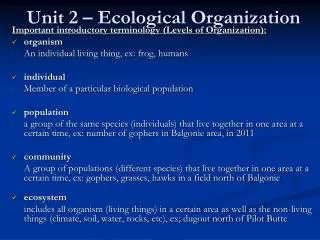
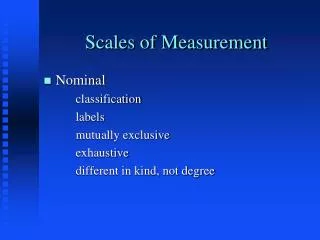
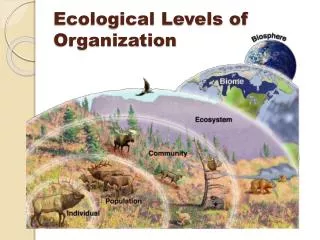
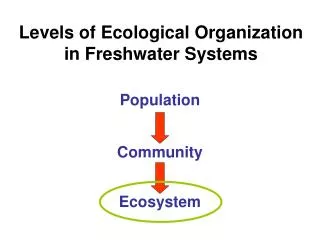
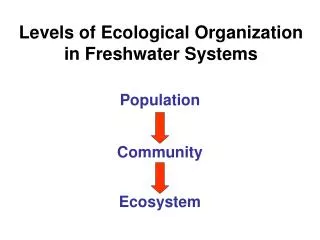
Scales of Ecological Organization Biosphere Ecosystem Community Population Organism
Definition Population ecology is the study of births, deaths, and the dynamics forces which regulate the number of individuals in a population.
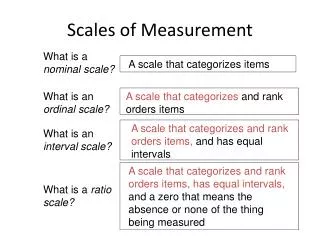
Density and Dispersion • Density • Is the number of individuals per unit area or volume • Dispersion • Is the pattern of spacing among individuals within the boundaries of the population
Population dispersion spatial patterns spaced-- may indicate competing individuals clumped-- may indicate social patterns or resource distribution
A random dispersion • Is one in which the position of each individual is independent of other individuals (c) Random. Dandelions grow from windblown seeds that land at random and later germinate.
(b) Uniform. Birds nesting on small islands, such as these king penguins on South Georgia Island in the South Atlantic Ocean, often exhibit uniform spacing, maintained by aggressive interactions between neighbors. Figure 52.3b • A uniform dispersion • Is one in which individuals are evenly distributed • May be influenced by social interactions such as territoriality
(a) Clumped. For many animals, such as these wolves, living in groups increases the effectiveness of hunting, spreads the work of protecting and caring for young, and helps exclude other individuals from their territory. Figure 52.3a • A clumped dispersion • Is one in which individuals aggregate in patches • May be influenced by resource availability and behavior
Density is the result of a dynamic interplay between processes that add individuals to a population and those that remove individuals from it. Births and immigration add individuals to a population. Births Immigration PopuIationsize Emigration Deaths Deaths and emigration remove individuals from a population.
The life table of Belding’s ground squirrels • Reveals many things about this population
1000 100 Number of survivors (log scale) Females 10 Males 1 2 8 10 4 6 0 Age (years) Figure 52.4 • A survivorship curve • Is a graphic way of representing the data in a life table… • The survivorship curve for Belding’s ground squirrels • Shows that the death rate is relatively constant
Population patterns in age structure
r- vs K-selection r-selection K-selection r is the rate of a population’s increase K is a population’s carrying capacity Disturbance Common, irregular Rarer, more regular Mortality Variable, unpredictable Constant, predictable Competition Low or variable High, constant Pop. size Variable, below K Rel. constant, near K Consequence High r Good competitors
Small size Rapid growth Early reproduction Many, small offspring Large size Slow growth Late reproduction Few, large offspring
A. Body size and r On average, small organisms have higher rates of per capita increase and more variable populations than large organisms.
K vs. r selection: extremes in parental care Sea urchins Humpback whales
Bottom line: Population GrowthGeometric growth vs. exponential growth vs logistic growth. When there are no limits, populations grow faster, and FASTER and FASTER! Invasive Cordgrass (Spartina) in Willapa Bay
The Simple Case: Geometric Growth • Constant reproduction rate • Non-overlapping generations (like annual plants, insects) • Also, discrete breeding seasons (like birds, trees, bears) Suppose the initial population size is 1 individual. This indivual reproduces once & dies, leaving 2 offspring. How many if this continues?
Exponential Growth Assumes continuous breeding life history strategy and overlapping generations.
www.smalltownproject.org/ Human Population Growth
What happens if there ARE limits? (And eventually there ALWAYS are!) Logistic Growth: The sigmoidal curve--carrying capacity (K) plays a role in determining population growth.
Human population patterns in age structure