Download
1 / 43
430 likes | 574 Views
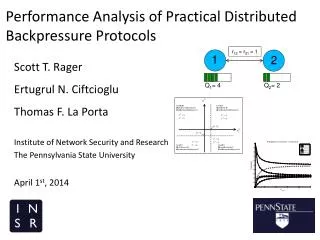
Analytical performance of soft clustering protocols. 산업대학원 전자공학과 강 우 현 . Abstract. The success of a mobile ad hoc network(MANET) is strongly related to the protocol used at the medium access control(MAC) layer.

E N D
Analytical performance of soft clustering protocols 산업대학원 전자공학과 강 우 현
Abstract • The success of a mobile ad hoc network(MANET) isstrongly related to the protocol used at the medium access control(MAC) layer. • Depending on the requirements and the specific network under concern, the protocol parameters at the MAC layer can be arbitrated to make best use of the channel resources. • Typically, extensive simulation studies are used to find the best values for these variables. • The problem with this approach is the need for excessive amounts of processing power and time. • As the dimensions of the decision space increase, the need for processing power grows exponentially. • This paper addresses this problem by developing an analytical model that reflects the relationships between protocol parameters and the overall performance of the protocol under various network conditions. • Specifically, we model the MH-TRACE cluster-based protocol, which is capable of supporting real-time data transmission. • The model is capable of estimating performance measures such as energy consumption and number of receptions while being simple enough to be run for a large set of parameters • The model can be used to optimize parameters of the protocol (such as the number of frames per superframe) as well as to predict the performance variations as the external conditions(such as data generation rate) vary.
1. Introduction (1) • In wireless communications, the goal of the medium access control(MAC) protocol is to efficiently utilize the wireless medium, which is a limited resource. • The effective use of the channel strongly determines the ability of the network to meet application requirements such as quality of service(Qos), energy dissipation, fairness, stability, and robustness. • Based on the collaboration level, MAC protocols can be classified into two categories: coordinated and non-coordinated. • In non-coordinated MAC protocols, nodes contend with each other. • IEEE 802.11 is an example of non-coordinated protocols. • Non-coordinated protocols are generally better suited for networks with low data rates. • On the other hand, in coordinated channel access protocols, there are regulating devices that determine how the medium is shared. • IEEE 802.15.3, IEEE 802.15.4 and MH-TRACE areexamples of such coordinated protocols. • In general coordinated access protocols are better suited for networks where the load is high. • Also, coordinated channel access schemes provide support for Qos, reduce energy dissipation and increase throughput for low-to-mid noise levels and for dense network.
1. Introduction (2) • IEEE 802.15.3, IEEE 802.15.4 and MH-TRACE all manage the multiple access scheme through a TDMA structure, as this approach has been shown to provide satisfactory performance in terms of Qos and energy dissipation. • MH-TRACE further uses a soft clustering approach where the clustering mechanism is utilized only for providing channel access to the member nodes. • Hence, each node is capable of communicating directly with every other node provided that they are within communication range of each other. • IEEE 802.15.3 and IEEE 802.15.4 only allow communication among the members of distinct clusters(piconets) in their peer to peer mode, while in star topology mode, nodes in distinct clusters can only communicate through their piconet controllers. • It is important not only to choose the correct protocol but also to adjust the parameters in accordance with the application requirements. • The true relationship between the parameters and the protocol performance can only be determined by analysis.
1. Introduction (3) • Although simulation studies reveal the performance of a protocol for a certain set of conditions, the statistical accuracy of the simulation results is questionable unless repeated extensively. • For large and dense networks, this approach requires excessive amounts of processing power. • Moreover, results obtained from those studies are only valid for the selected parameters and do not reveal the full impact of these parameters on the performance of the protocol. • => Problem
1. Introduction (4) • In order to address this problem, we have developed an analytical model that reflects the relationships between the protocol parameters and the overall performance of the protocol under different network conditions for TDMA-based clustered protocol, MH-TRACE. • Specially, we develop a model that relates the TDMA frame parameters(number of slots per frame and number of frames per superframe) and the node density to the expected number of droppped packets and the expected number of collisions. • This model enables us to find the set of parameters that maximize overall throughput or energy efficiency for TDMA-based clustered protocols such as IEEE 802.15.3(peer to peer mode), IEEE 802.15.4(peer to peer mode) and MH-TRACE. • We use this model to analyze the MH-TRACE protocol.
2. Related work (1) • Various analytical studies of protocol performance exist in the literature. • These studies range from detailed protocol specific models to more general models that can be applied to a group of protocols. • One line of research is focused on more generalized analysis that covers a set of protocols that share a certain property. • These studies use more generalized assumptions and focus on certain descriptive performance metrics rather than trying to model details of a certain protocol. • For example, the authors in [6-8] study the optimal size of a cluster for cluster based data aggregation schemes without going into the protocol dependent parameters. • Studies on the delay and the throughput characteristics of TDMA/CDMA MAC protocols, such as those described in [9,10], also fall under this category. • Protocol specific studies approximate the protocols under concern in detail using protocol dependent assumptions. • Bianchi [11] present a simple analytical model to compute the saturation throughput performance of the IEEE 802.11 Distributed Coordination Function. • Later on, more detailed studies on IEEE 802.11 have been proposed, based on the protocol and its extensions [12-14] such as IEEE 802.11e, which has several quality of service(Qos) enabling features to support real-time traffic.
2. Related work (2) • Being one of the most widely used network types, GSM networks have also attracted considerable attention, with most of these works analytically deriving the performance of GSM networks. • For example, In [15], a model for cell dimensioning and performance evaluation is presented. • IEEE 802.15.4 is another widely studied protocol. • The very first analytical study of IEEE 802.15.4 was described in [16] in the context of medical sensor body area networks. • Various other papers [17-20] have been published since then, having different sets of assumptions and different operation modes of the protocol. • For instance, in [17] the analysis is focused on the star topology, while in [18], a peer to peer beacon-enabled cluster-tree structure is considered. • Similar analytical studies for IEEE 802.15.3 can be found in the literature, such as the ones in [21,22]. • Our work lie in between those approached for analyzing protocol performance. • Even though we focus on a specific cluster based MAC protocol utilizing soft-clutstering, namely MH-TRACE, the assumptions used in the analysis make the generation of the model to other MAC protocols that employ a TDMA structure possible.
3. Background (1)[Clustering approaches] • Regardless of the partitioning scheme, the main consideration in forming clusters is the load distribution in the network. • Clusters should be formed in such a way that they are able to meet the demand for channel access of the nodes in the cluster as much as possible. • When the cluster is not able to meet the demand, either some of the transmissions are deferred(better suited for guaranteed delivery traffic) or the packets are dropped(better suited for best effort traffic). • Thus, while designing a protocol or determining the performance of a specific protocol, the load distribution has crucial importance. • Clustering approaches may be classified as soft and hard clustering. • In hard clustering approaches, such as GSM networks [23], nodes belong to the cluster in which they operate. • Direct communication is only possible within the cluster. • On the other hand, in soft clustering approaches such as MH-TRACE, nodes interact with clusterheads only to obtain channel access. • There is no membership relation between the nodes and the clusters. • In other words, nodes are able to communicate directly with the nodes of other clusters and to choose the cluster form which they receive channel access.
3. Background (1)[Clustering approaches] • In general, soft clustering approaches are superior to hard clustering approaches in distributing the load evenly among clusters. • On the other hand, soft clustering approaches tend to be more vulnerable to interference and collisions among co-frame clusters since the boundaries of the clusters are not strict. • In this paper, we consider soft clustering approaches. • Due to fading, two distinct transmissions may successfully operate over the same frequency, code and time range if they are well separated spatially. • A successful protocol should employ this kind of spatial reuse for the sake of efficient use of the channel resources. • Clustering protocols, aim to maximize the distance between the clustering using the same portion of the channel. • In cellular networks, the same set of frequencies may be assigned to cells(clusters) that are separated well enough depending on the frequency reuse factor employed [24. chap.3]. • Analogously, in MH-TRACE, each cluster operates in one of several frames separated in time. • MH-TRACE had internal mechanisms that maximize the distance between clusters operating in the same frame(co-frame clusters)[4].
3. Background (2)[MH-TRACE summary] • In this work, we analyze the performance of soft clustering protocols to determine how to best set their parameters for efficient use of the channel resources. • Specifically, we analyze the MH-TRACE protocol. • A detailed description of MH-TRACE is available in [4]. • In MH-TRACE, time is divided into superframes of equal length, as shown in Fig. 1, where the superframe is repeated in time and further divided into frames.
3. Background (2)[MH-TRACE summary] • There are randomly chosen clusterheads that regulate the channel and provide channel access for the nodes in their communication range. • Each clusterhead(CH) operates using one of the frames in the superframe structure. • There is also a spatial reuse mechanism that allows more than one CH to operate in the same time frame provided that the interference is low. • Each frame in the superframe is further divided into sub-frames. • The control sub-frame constitutes the management overhead. • Beacon, cluster announcement(CA), and header slots of the control sub-frame are used by the CHs, whereas contention slots and information summarization(IS) slots are used by the ordinary nodes. • At the beginning of the frame, the CH announces itself to the nearby nodes by sending a beacon message in the beacon slot of the control sub-frame. • The CA slot is used for interference estimation for CHs operating in the same frame(co-frame CHs).
3. Background (2)[MH-TRACE summary] • During the CA slot, the CH transmits a message with a given probability or listens to the medium to calculate interference caused by other CHs operating in the same frame. • Contention slots are utilized by the nodes to pass their channel access requests to the CH. • A node that wants to access to the channel selects a contention slot randomly among the contention slots and sends a contention message in that slot. • After listening to the medium during the contention slots, the CH becomes aware of the nodes that request channel access and forms the transmission schedule by assigning avaliable data slots to the nodes. • After that, the CH sends a header message that includes the transmission schedule that will be followed for the rest of the frame. • There are an equal number of IS slots and data slots in the remainder of the frame. • During the IS slots, nodes send short packets summarizing the information that they are going to be sending in the order announced in the Header.
3. Background (2)[MH-TRACE summary] • By listening to the relatively shorter IS packets, nodes become aware of the informaition that are going to go sent and may choose to sleep during the corresponding data slots. • In our case all the nodes that can successfully receive the IS packet listen to the corresponding data slot, since we are testing the performance of the MAC layer only.
4. Analytical model • The model is built on our initial work in [25]. • The model is simple enough to be evaluated for a large number of parameters and provides estimates of simulation averages, eliminating the need for complicated simulation studies. • Clustering protocols divide the available channel into a number of partitions and assign regulatory nodes, namely CHs, to each partition forming the clusters in the network. • Each partition may be used by more than one cluster depending on the spatial reuse factor. • Using a high spatial reuse factor leads to having a smaller number of larger channel partitions and in turn a higher amount of concurrent traffic that can be supported per cluster, which decreases the number of dropped packets. • On the other hand, since there are more clusters using the same partition simultaneously, the interference and the collisions increase. • In terms of throughput, the performance of a protocol is limited both by the dropped packets and by the collisions. • Therefore, these effects must be taken into accout in performance estimation.
4. Analytical model (1)[Dropped packets] • In real-time communications, packet timing is one of the most critical factors. • It is preferable to discard packets that are not transferred in a timely fashion. • Hence, packets become obsolete after a predetermined amount of time and must be dropped from the transmit queue. • Any load over the maximum amount of concurrent traffic that can be supported, MaxTraffic, will eventually be dropped. • The probability of dropping a packet can thus be calculated as • Analysis can most easily be performed on a per cluster basis, as the amount of traffic that can be supported by CH is well defined. • Hence, using the TDMA frame as the time unit, Load and MaxTraffic can be defined as the number of nodes that require channel access within a cluster pef frame and the number of data slots available per frame, respectively. • MaxTraffic directly follows from the parameters of the protocol and hence is deterministic.
4. Analytical model (1)[Dropped packets] • On the other hand, Load is a stochastic process that depends on various random variables. • Since MaxTraffic is known, calculating reduces to calculating the distribution of Load for the clusters. • The load in the cluster is mainly determined by three probabilities. • In this paper, we assume that the network is supporting voice traffic. • We further assume that each node generates independent voice packets according to a common voice traffic model where nodes are either in “spurt” or “gap” duration, with voice data being generated in the “spurt” duration and no data being generated in the “gap” duration [26-28]. • Hence, accounts for the fact that nodes will only have data to send when they are in the “spurt” duration.
4. Analytical model (1)[Dropped packets] • Since we consider a soft clustering approach, nodes can access the channel from any CH within range. • Therefore, if one CH has no available bandwidth, a node can request channel access from another CH in range. • Hence, takes into account the fact that a node’s expected load to a cluster is distributed among those CHs in the communication range of that node. • Given these distributions and the number of nodes in the network, N, the load per cluster per superframe for a given CH isa binominal distribution with a success probability of as
4. Analytical model (1)[Dropped packets] • The probability of finding a node in the spurt state, . is calculated as • The probability of a node to be in any given region is • The coverage region of a cluster is assumed to be a circle centered at the CH’s location having a radius equal to the maximum reliable communication distance at the selected power level. • The coverage area that lies within simulation area are calculated in [29]
4. Analytical model (1)[Dropped packets] • The expected number of nodes within the communication range, of a CH(and for any node) can be calculated using • Nodes can select their channel access provider uniformly among the CHs that are in their communication range. • Therefore, the expected load of a node to a CH, can be calculated as given in (4) • can be obtained using the distribution of Load and
4. Analytical model (2)[Collisions] • Under maximum packing conditions, a third CH is also separated by fromboth of the previous CHs, as shown in Fig.3. • The lines connecting the 3 CHs form an equilateral triangle. • At most 6 CHs can be located around the first CH, as shown in Fig.3. • Considering an imaginary cell boundary passing perpendicular to the lines connecting the neighboring CHs, a hexagonal cellular structure can be constructed in the form of the standard structure used in cellular systems [30]. • The separation between co-labeled cells and hence co-frame CHs is given as
4. Analytical model (2)[Collisions] • We use this separation as a basis to calculate the expected number of collisions, even though a regular structure that maximizes the distance between co-frame CHs exist only for a certain set of values. • Fig 4 shows two such circles. • The intersection area, which is shown as the shaded area in the figure, can be calculated as
4. Analytical model (2)[Collisions] • The vulnerable region for two co-frame CHs isthe area of intersection of two circles with radii of and and centers located at the co-frame CH positions. • The lightly shaded area in Fig.5 depicts the vulnerable region for two CHs(represented by the dianmonds) separated by a distance of • The nodes in the vulnerable region are calledvunerable nodes. • In Fig.5, the little disk located (x,y) represents an arbitrarily selected node among the vulnerable nodes.
4. Analytical model (2)[Collisions] • The expected number of nodes in these regions for the selected node at (x,y), • and corresponding to the left and right hand side clusters are: • For a sufficiently large node density, the expected number of data collisions per frame due to those candidate nodes, can be approximated as :
4. Analytical model (2)[Collisions] • Averaging over the vulnerable region, V, and multiplying by the expected number of nodes in a cluster leads to the expected throughput loss on the transmissions from the nodes of one cluster due to one co-frame cluster, • The collisions between each co-frame CH pair decreases the number of packet receptions of the packet transmitted by the members of the CH by . • The number of collisions per node per superframe, is calculated as in (13)
4. Analytical model (3)[Throughput model] • The voice application under concern generates one packet per superframe when the nodes are in spurt state. • Each generated packet is dropped with a probability of and transmitted otherwise. • The number of packets transmitted per superframe per node, can easily be obtained by subtracting the number of dropped packets from the number of generated packets and dividing by the number of nodes as in (16a). • This definition is indicated implicitly by the simplified form of the equation given in (16b) as the multiplication of the probability of not dropping a packet with the probability of being in spurt duration.
4. Analytical model (3)[Throughput model] • An ideal case of no collisions, the number of packets received per node per suferframe would be • However, collisions prevent some packets from being received successfully. • The number of collisions per node per suferframe, is calculated in Section 4.2.
4. Analytical model (4)[Energy model] • In addition to throughput, ennergy dissipation is an important parameter to evaluate for a given protocol. • Thus, here we describe our energy model that is built off our throughput model described in the previous sections.
4. Analytical model (4)[Energy model-State durations for ordinary nodes] • The first step in calculating the state durations is to determine when the nodes are transmitting. • Considering the frame structure in Fig.1,, it can be observed that the ordinary nodes only transmit during the contention, IS and data slots. • For each data slot, nodes transmit one IS slot to announce the data that will be sent. • Given which was calculated in the previous section, can be calculated as in (19) • Nodes listen to the Beacon, CA and all IS slots in all the frame unconditionally. • The data slot is only listened if the corresponding IS packet is successfully received. • A node listens to the header slot only if it has data to send, in other words when the node is in spurt state.
4. Analytical model (4)[Energy model-State durations for ordinary nodes] • Nodes can receive Beacon and CA packets from the CHs in their receiving range. • Unless nodes go out of the transmission range just after the beacon message, nodes can receive the corresponding header message as well. • IS slot length should be multiplied by the number of transmitting nodes within interference range but not within communication range to calculate the time spent for carrier sensing in IS slots. • The remaining listen time is allocated as the idle time as in (23)
4. Analytical model (4)[Energy model-State durations for CH] • In addition to the data and IS slots, CHs also transmit Beacon, CA and Header slots of their frame. • However, CA messages are transmitted with probability : otherwise CHs listen to these slots. • CHs are in the listening state during all the beacon slots other than the one in its own frame, CA slots other than the one it is transmitting, contention slots of its frame, all IS slots in all frame, and as many data slots as for an ordinary node.
4. Analytical model (4)[Energy model-State durations for CH] • is equal to the other than the header slot since CHs are in the transmission state during that slot. • Neglecting the effects of slots,
5. Validation of the analytical model • For comparison purposes, we conduct ns-2 simulations of MH-TRACE under different network scenarios and for various number of frames per superframe, • values. • Table 2 shows details of the frame timing for each value of
6. Optimization of spatial reuse • The degree of spatial reuse directly affects the performance of the protocol, both in terms of throughput and energy consumption. • In TDMA-based protocols such as MH-TRACE, the degree of spatial reuse is determined by the number of frames per superframes, • The analytical model introduced in this paper can be utilized to optimize • for an arbitrary node density. • Another important metric for a MAC protocol is the number of received packets per unit energy consumption.
7. Varing the data generation rate • The model can also be used to estimate the performance of the protocol as parameters external to the protocol, such as data generation rate, are varied.
8. Conclusion • In this paper, we introduced an analytical model that estimates the performance of MAC protocols employing a soft-clustering structure and a TDMA channel access scheme, specifically the MH-TRACE protocol. • The model eliminates the need for cumbersome and lengthy simulations to evaluate the performance of the protocol. • The analytical model presented in this paper is simple enough to be run in seconds for a large number of parameter sets yet powerful enough to be used in optimization studies. • By using simple probability distributions, the model accurately estimates the loss in throughput due to dropped packets and collisions, and thus can determine the expected throughput, the time spent at each energy state by the CHs and ordinary nodes, and the average energy consumption of each node in the network. • The analysis made in this paper also reveals the importance of proper adjustment of the parameters according to the network conditions. • It has been shown that improper selection of the parameters may result in serious throughput losses (up to 33% for stationary and 32% for mobile scenarios) and increased energy consumption per data reception(up to 7.5% for both stationary and mobile scenarios) in dense networks. • Other factors such as transmitting power and noise levels as well as mobility patterns also may have an impact and are the subject of future work.