Download
1 / 15

E N D
Nuclear Reactions In matter, all fast protons undergo electromagnetic (EM) interactions with atomic electrons (which slow them down) and nuclei (which scatter them). In addition, some (about 23% for 160 MeV protons in water) have a head-on collision with an atomic nucleus. Though the proton survives this train wreck, it generally comes out with much less energy and at some large angle to the beam, accompanied by other charged and neutral secondaries and a residual nucleus. In this lecture we’ll learn what reactions occur, how we classify them, and how they affect proton radiotherapy, particularly the Bragg peak. Nuclear reactions are unlike slowing down and scattering (for which there are accurate and relatively simple theories) in that theoretical models are complicated and less well tested. Luckily, their only significant effect is to change the shape of the Bragg peak, which we can take into account simply by using measured rather than predicted Bragg peaks in our designs. That’s something we have to do anyway for other reasons. In addition to the systematics of nuclear interactions, we’ll talk about ways of measuring them. These allow us to test Monte Carlo nuclear models at therapy energies. Even though Monte Carlo calculations are not needed for beam line design, they are essential for other problems like RBE estimates, unwanted neutron dose to the patient and neutron shielding, and testing them increases our confidence.
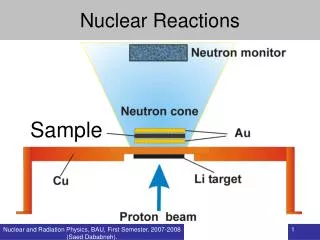
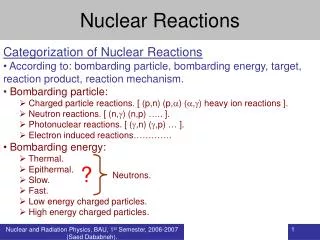
Classification The possible varieties of nuclear reaction are defined (for purposes of radiation therapy calculations) by ICRU Report 63, ‘Nuclear Data for Neutron and Proton Radiotherapy and for Radiation Protection’ (2000). The excerpt below, from the draft of “Passive Beam Spreading in Proton Radiation Therapy”, is a brief summary. It also shows the standard notation for nuclear reactions.
Include Free Hydrogen! Many materials of interest (e.g. water) contain free hydrogen. At therapy energies, the inelastic cross section (proton-proton bremsstrahlung) is miniscule and the nonelastic cross section is zero. However, the elastic ‘billiard ball’ reaction yields two protons, approximately at right angles to each other, whose characteristics mimic charged nuclear secondaries: they have reduced energies and very large angles to the beam. If we are interested in the changing composition of the primary beam, we ought to include this process.
What Are the Secondaries? The relative importance of different secondaries can be measured by estimating what fraction of the energy each kind carries off. Seltzer, ‘An assessment of the role of charged secondaries from nonelastic nuclear interactions by proton beams in water,’ NISTIR 5221 (1993) found, for 150 MeV protons on O : Charged particles 0.64 ; neutrons 0.2 ; photons 0.16 . α’s are always surprisingly high because the α is a very stable cluster. These numbers are Monte Carlo estimates. Direct experiments are very difficult. Many people think that the nucleus ‘breaks up’ in an inelastic reaction. That almost never happens. Light nuclei don’t undergo fission! Protons are always the most common secondaries by far. Neutrons are next. Think of the incident proton as knocking out another proton, neutron or small cluster, with additional protons or neutrons sometimes resulting from a cascade of direct interactions. In Monte Carlo jargon this is the ‘Bertini model’.
Local Energy Deposition Secondaries (mostly protons) have short ranges and large angles. The reaction cross section is nearly independent of energy so the pattern of energy deposition only varies slowly with depth. Therefore it is a good approximation to say that all of the charged secondaries’ energy is deposited locally, at the interaction point. Although that isn’t true, it works mathematically as soon as longitudinal equilibrium is established. Of course, it doesn’t work at the entrance point . Some energy is carried away to distant points by neutrons. That means the total energy (therefore dose) deposited in the water does not quite equal the energy lost by the incident protons (their incoming energy). If we integrate the Bragg peak to compute the average energy deposited, we find a deficit that increases with incident energy.
Nuclear Buildup The local energy deposition approximation fails at the entrance to a water tank where longitudinal equilibrium has not yet been reached. You can see this if you measure a Bragg peak vertically so that the proton beam enters from air. This scan, courtesy of IBA, is from the Burr Center. An excellent early paper is Carlsson and Carlsson, ‘Proton dosimetry with 185 MeV protons: dose buildup from secondary protons and recoil electrons,’ Health Physics 33 (1977) 481-484 which also covers the (much more rapid) electron buildup. They point out that the observed nuclear buildup is smaller than one would expect, which is also true of the depth-dose shown above and has so far not been satisfactorily explained.
Effect of Nuclear Reactions on the Bragg Peak This figure is a Monte Carlo calculation by Martin Berger (NISTIR 5226 (1993)). Dashed line: nuclear reactions switched off; solid line: actual BP. Buildup, not usually a problem because of the likely presence of buildup material near the patient, is ignored. Dose from the EM peak shifts upstream, lowering the peak and flattening the entrance region, especially at high proton energies. Because nuclear reactions are hard to model, we take them into account by using a measured (rather than predicted) Bragg peak to deduce an effective stopping power which includes nuclear reactions.
Non-Elastic Cross Section One of the few simple things about nonelastic nuclear reactions is that the total cross section is fairly independent of energy. These figures use data from Janni’s 1982 range-energy tables. Left: total cross section for oxygen as a function of proton residual range. Right: probability of a nonelastic interaction in water as a function of range in water. The slope is between 1.6% and 0.6%/(g/cm2); 1%/(g/cm2) is a good rule of thumb.
Measuring Nonelastic Reactions These pictures were shown in an earlier lecture to illustrate the concept of proton range but they are equally useful in explaining nonelastic reactions. A Faraday cup (charge collector) is used as a proton counter. As increasing amounts of degrader are placed in front, the charge collected per beam monitor unit decreases, because primary protons are lost. If the FC is somewhat far away (as shown, solid points) it will collect all primaries because the EM multiple scattering angle is small, but miss almost all secondaries. If the FC is very near the degrader stack (hollow points) it will pick up some of the charged secondaries and we will see a slower, non-linear, decline. The final precipitous drop is due to the primary protons ‘ranging out’ by EM energy loss.
A Historical Accident We discovered the two different kinds of falloff behavior (previous slide) accidentally. For many years at HCL we had only a ‘real’ FC (left) whose construction prevented us from putting degraders very near the collection cup. After we started using ‘Poor Man’s Faraday Cups’ (example at right) we were able to get the degrader right up against the charge collector, and observed the change in the nuclear falloff.
Measuring Nonelastic Reactions (MLFC) One could, of course, test the nuclear model of any particular MC code by seeing if it reproduced the observed falloff due to nonelastic reactions. A far more sensitive test is possible with a Multi-Layer Faraday Cup (MLFC), a stack of insulated plates (left) which measures the range distribution of the proton beam. The MLFC is normally used as a range verifier and shows a narrow peak (right) from protons that stop by the EM process.
MLFC (continued) If we zoom in on the region preceding the big peak, we see a simple and perfectly reproducible pattern: the range distribution of charged nuclear secondaries. This starts at 0 (because almost none enter the MLFC) and gradually builds up. The spectrum cleanly separates nuclear and EM interactions because all nuclear secondaries have shorter ranges than the surviving primaries. This contrasts with the Bragg peak (right) where the two processes are mixed up and the effect of switching off nonelastics is rather subtle. Also, this is an absolute test of the cross section built into the MC because no normalization is needed: the number of protons entering the MLFC is known to ±1%.
MLFC (continued) This is one of the best benchmarks of MC nuclear models available in the clinical energy range. In addition to cleanly separating nuclear and EM effects, it has the advantage of measuring charge rather than dose (avoiding any issues of dosimeter nonlinearities) and of having 100% acceptance for secondaries (making the MC geometry extremely simple). Right: Gottschalk, Platais and Paganetti (Med. Phys. 26 (1999) 2597, copper MLFC). (Rachel Platais, then a cyclotron operator at HCL, built the first MLFC.) Left: Mascia et al., Proc. XIVth ICCR (2004) 478 using data from Paganetti and Gottschalk, Med. Phys. 30 (2003) 1926, CH2 MLFC shown earlier. All the currently popular MC’s do pretty well.
Effect on RBE Some nuclear secondaries have very high dE/dx (energy loss per unit distance or LET) and are therefore expected to have a considerably higher RBE than protons. What is the average effect throughout the SOBP? In the early days of proton radiotherapy this was a source of concern. It was first studied by Seltzer (‘An assessment of the role of charged secondaries from nonelastic nuclear interactions by therapy proton beams in water,’ NIST technical note NISTIR 5221 (1993)). He concluded that the average effect was small, mainly because the secondaries deposit so little dose that their high LET exerts little influence. Since then it has been studied by others including Paganetti (‘Nuclear reactions in proton therapy: dose and relative biological effect distributions originating from primary and secondary particles,’ Phys. Med. Biol. 42 (2002) 747-764). He found that secondary protons contribute about 10% of the dose proximal to the SOBP and that the RBE there may be about 8% higher due to secondaries (protons and α’s). Distal to the BP, however, RBE enhancement is due to the low energies of the primary protons and the RBE mas be as high as 1.3. (Other writers have found values up to 1.6.) He considered the net RBE effect of residual nuclei (which certainly have very high LET and short range ≈3μm) and concluded it was negligible. In sum, charged secondaries from nonelastic reactions appear to increase RBE by a barely significant amount. Unwanted neutron dose will be covered in a separate lecture.
Summary Nuclear reactions in which the residual nucleus is not the same as the target nucleus are called nonelastic. The secondary particles in descending frequency are protons, neutrons and alpha particles. Other light fragments such as d, t, and 3He are negligible. Because the nonelastic cross section is almost energy independent the longitudinal pattern of energy deposition is almost independent of depth. Therefore longitudinal equilibrium develops and one can make the approximation that the energy of the secondaries is deposited locally (at the reaction point) even though that is not really the case. Longitudinal equilibrium does not obtain at the entrance. Thus, one can observe nuclear buildup in the Bragg peak if the beam enters the water vertically so there is no buildup material. In a treatment situation there is almost always some buildup material so nuclear buildup should be ignored in beam line design. The observed nuclear buildup is about 2× smaller than expected, an unsolved (though somewhat academic) problem. The simplest direct evidence for nuclear interactions is the slow decrease in collected charge if an increasing amount of absorber is put in front of a Faraday Cup. A more precise version of this experiment can be done with a multi-layer Faraday Cup (MLFC), and such measurements agree well with modern Monte Carlo simulations. Estimates of the RBE increase due to nuclear secondaries show it to be small but not entirely negligible. Obviously, measurements of RBE in a proton beam include this contribution. The RBE of ‘pure’ protons may be nearer 1 than is usually thought.