Analysis of H8 Crystal Data for Beam Steering Techniques in Particle Physics
This study, part of the UA9 collaboration, focuses on techniques for steering ultra-relativistic proton and heavy ion beams using bent crystals to enhance beam collimation at the LHC. We analyze extensive data from 15 tested crystals between 2009 and 2012 in the H8 facility, exploring parameters such as bending angles, channeling efficiencies, and angular distributions. Our findings include detailed measurements and characterizations of the crystals through various acquisition runs, contributing valuable insights for crystal code development and future simulations.

Analysis of H8 Crystal Data for Beam Steering Techniques in Particle Physics
E N D
Presentation Transcript
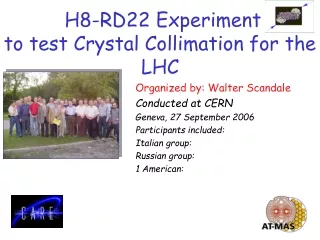
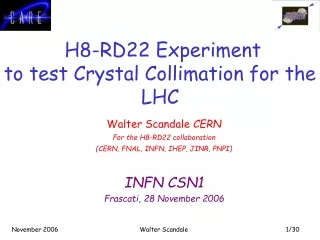
H8 crystal data analysis 16/05/2014 – ColUSM meeting Roberto Rossi Daniele Mirarchi, Stefano Redaelli, Walter Scandale, GianlucaCavoto
Table of contents • Introduction • H8 crystal run • Analysis example • Alignment run • High statistic run • Geometrical and angular cuts • Torsion correction • Channeling efficiency analysis • Dechanneling length • Transition region • Population analysis • Angular scan run • Volume capture population analysis • Conclusions R. Rossi - H8 crystal data analysis
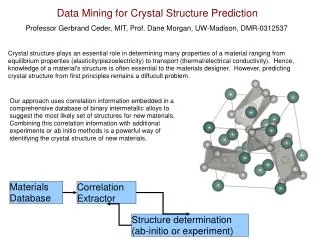
H8 Crystal test Beam The UA9 collaboration is studying techniques to steer ultra-relativistic beams with bent crystals to improve the collimation of proton and heavy ion beams at the LHC. Measurements of key crystals properties(bending angle, channeling efficiency, etc..) are performed on the SPS extraction line (H8) with 400 GeV/cprotons before testing crystals with circulating beams. Scope of my master thesis work:Consistently analyze all the crystals tested in H8 (total of 15 between 2009-2012). - Compile a comprehensive statistical treatment of different crystals - Identify “fine” systematic effects (e.g., transitions) - provide inputs to crystal code developers Immediate goal: compile list of experimental data for an upcoming workshop on crystal simulations. R. Rossi - H8 crystal data analysis
H8 experimental Layout • Five silicon micro-strip sensors (active area 3.8x3.8 cm2 in the x-y plane) are used to track the particles in the plane orthogonal to the beam directionbefore and after passing through the crystal. [1] M. Pesaresi et al., Design and performance of a high rate, high angular resolution beam telescope used for crystal channeling studies,2011 JINST 6 P040006 R. Rossi - H8 crystal data analysis
Track reconstruction • Only one track per event is reconstructed. • The event reconstruction uses the first two and the last two detectors to measure the incoming and the outgoing angle of the tracks, respectively. • The impact point at the crystal position is given by the interpolation of the incoming and the outgoing tracks. R. Rossi - H8 crystal data analysis
Experimental data structure A complete experimental characterization of a crystal consists of different acquisition runs • “Alignment” run: used to validate the telescope performance without crystals on the beam line • Transverse position scan: used to find the crystal, when it crosses the beam • Crystal angular scan: used to identify the interesting angular regions - amorphous, channeling and volume reflection orientations. • High statistic acquisitions: performed in the region where we want fully analyze a given effect. Typically, done in the optimum channeling orientation. R. Rossi - H8 crystal data analysis
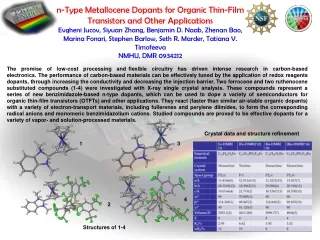
UA9 Crystals Two kind of crystals were test in H8 • Strip crystal : the anticlastic bending is induced on the planes (110) • Quasi-mosaic crystal : the anticlastic bending is induced on the planes (111) The main difference is that the strip channels have all the same width, while the QM have a main channel and a smaller secondary (1/3). A total of 15 crystals were analyzed, 10 strip and 5 quasi-mosaic R. Rossi - H8 crystal data analysis
Run Analysis We developed analysis tools in Root to get from the raw data (details in next slides): • Alignment run -> • check of beam parameters (e.g. input distributions on crystal) • telescope resolution • Hi stat CH -> • Geometrical cut (different strategy between ST and QM) • Torsion correction • Crystal channeling efficiency • Dechanneling length • First look to transition region • Angular scan run -> • Volume capture features The analysis for the STF45 crystal is shown in the following slides as a case study R. Rossi - H8 crystal data analysis
Alignment Run Analysis • With the crystal removed from the line is possible to measure the key parameters : • Beam divergence • Beam distribution • Telescope resolution R. Rossi - H8 crystal data analysis
Alignment Run Analysis The incoming beam spot can be well approximated by a double Gaussian (see next slide). The surrounding background (square area in light blue) is given by the interaction of the beam particle with the micro collimators placed at the beginning of the line; When the micro collimators are moved the shape of the background change. R. Rossi - H8 crystal data analysis
Alignment Run Analysis Here we can see the beam profile in the orthogonal plane. The plots show the double Gaussian shape of the beam core with a sigma of 0.96 mm and 0.72 mm in x and y respectively. The asymmetric tail are not fitted, because are the background due to the micro collimators. R. Rossi - H8 crystal data analysis
Alignment Run Analysis The beam divergence is found to be 10.67 μrad in x and 7.66 μrad in y. This beam characteristics are crucial for the key measurements. Because the input angular distributions are bigger than θc, we need to apply a selection to analyze the different effects. R. Rossi - H8 crystal data analysis
Alignment Run Analysis This plot shows the difference between the outgoing and the incoming angle of the tracks without any object on the beam line. The sigma of this distribution gives us the telescope resolution taking into account a variety of systematic effects, including scattering in air. The resolution of the telescope is 5.7 μrad in good agreement with the resolution estimated in [1]. [1] M. Pesaresi et al., Design and performance of a high rate, high angular resolution beam telescope used for crystal channeling studies,2011 JINST 6 P040006 R. Rossi - H8 crystal data analysis
Alignment Run Recap Each crystal has a good alignment run If a run is missing, the closer one is used. R. Rossi - H8 crystal data analysis
Hi Stat @ Channeling Two kinds of cuts are performed on the initial distributions: • Geometrical cut • Angular cut The geometrical cuts are used to select particle impinging on the crystals and can be established by looking at the spread given by the multiple coulomb scattering. The angular cuts are performed to study the coherent interactions in crystals. R. Rossi - H8 crystal data analysis
Geometrical cut Cut -> [-0,1;0,2] mm R. Rossi - H8 crystal data analysis
Cut recap The table summarize the geometrical cuts made R. Rossi - H8 crystal data analysis
Torsion Analysis For particles with the same impact angle, the torque applied to the crystals causes different relative angles with respect to the crystal planes. The difference if proportional to the y impact location. This effect is defined as torsion. As a result, the channeling efficiency varies with both the horizontal impact angle and the vertical impact position. The channeling efficiency is defined as the number of channeled particles normalized to the total number of particles Channeled events are calculated from the deflection profile R. Rossi - H8 crystal data analysis
Efficiency vs. Impact angle x vs. Impact y 2-dimensional efficiency plot as a function of impact x angle and impact y points is obtained. The center of gravity of each stripes on the impact y point axis gives the mean impact x angle as a function of vertical impact position R. Rossi - H8 crystal data analysis
Efficiency vs. Impact angle x vs. Impact y STF48 • The linear regression gives the torsion value and the initial impact angle offset R. Rossi - H8 crystal data analysis
Torsion correction If we define the impact x angle as The torsion correction made is The plots show the x deflection as a function of the impact x angle before and after the torsion correction R. Rossi - H8 crystal data analysis
Torsion Recap The calculated torsions are summerized in this table R. Rossi - H8 crystal data analysis
Hi Stat @ Channeling Analysis The optimum channeling condition is the one studies in more detail. • All the analysis are performed bystudying the deflection x angle as a function of the impact x angle. • We can then distinguish three regions with respect to the x deflection • Channeling, the spot around 150 μrad • Transition region between the amorphous and the volume reflection zone • Dechanneling, the region between the first two R. Rossi - H8 crystal data analysis
Channeling Efficiency The channeling efficiency is evaluated at two different angular cuts ± 5 e ± 10 μrad, that for 400 GeV/c protons represent the critical angle for channeling and two times the critical error, respectively. Projecting on the y axis the kick, with the cut described, are obtained. ± 10 μrad ± 5 μrad At ± 5 μrad the channeling efficiency is measured to be 0,69. R. Rossi - H8 crystal data analysis
Channeling efficiency recap That is the recap of the channeling efficiency for the analyzed crystals R. Rossi - H8 crystal data analysis
Dechanneling length On the same histogram the dechanneling length analysis is also performed A channeled particle can escape from the channel due with the interaction with the crystal plane, this particles are defined as dechanneled particles. The dechanneling probability is described as an exponential decay as a function of the kick angle: the characteristic dechanneling length is calculated from an exponential fit in the dechanneling region. This is a key parameter to improve simulations. ± 5 μrad ± 10 μrad R. Rossi - H8 crystal data analysis
Dechanneling Length ± 5 μrad The exponential fit gives the dechanneling angle. To get the dechanneling length we have to multiply the parameter by the bending radius of the crystal. Variation on the fit range don’t show significant changes of the dech length, that is estimated to be ~ 1,4 mm R. Rossi - H8 crystal data analysis
Dechanneling length recap That is the recap of the dechanneling length R. Rossi - H8 crystal data analysis
Transition zone The transition zone describes how the amorphous region is transformed to the volume reflection region after the channeling region The trend plotted would be useful for a confrontation with the crystal simulation routines. R. Rossi - H8 crystal data analysis
Population The Population of the three different region are evaluated as a function of the impact incoming angle. R. Rossi - H8 crystal data analysis
Angular Scan Analysis The angular scan has the same geometrical cuts and torsion correction. The deflection x as a function of the impact x angle is shown In this case we can see all the volume reflection region, and the halo that have the same trend of the channeling spot is the volume capture region. Non-channeled particles can be channeled due to the interaction with the crystal plane. This particles are defined as captured. R. Rossi - H8 crystal data analysis
Volume capture analysis We define the region of captured particle as the area within 3 σ of the trend of the channeled spot The captured population is plotted as a function of the impact x angle. The rise in the end of reflection region is a well-known behavior. This analysis is performed for the first time, we are looking for a model that describes the trends observed. R. Rossi - H8 crystal data analysis
Example of QM The crystal face xy is not flat, because of a characteristic additional bending on the QM crystal • the kick as a function of the impact position (on a fixed crystal) shows a behavior similar to an angular scan. We have to find a region where this curvature is negligible. R. Rossi - H8 crystal data analysis
Conclusion Achieved goals : • A complete analysis of the crystal tested in the H8 line has been done. • The results of the present analysis fit the results in literature. • Many fine systematic effect were analyzed. • A complete list of experimental data and inputs are ready for crystal code developers. Future goals : • understanding and development of an analytical model of the various “fine” effects observed. • implementation of the analytical models to improve the crystal simulation routines. R. Rossi - H8 crystal data analysis
backup R. Rossi - H8 crystal data analysis
recoDatacaratteristicdfs/Experiment/UA9/Data-Test_beams • 2010 data [/2010_09_16,_H8_re-recodata] • reconstruction problem • Each variable is in the array “thetaIn_x”, inside the “tracks” branch • The data was reprocessed because of a bug, but some interesting run is still missing • 2011 data [/2011_09_07_recodata4] • Optimization problem • Each variable in some branch is aa array (100 place), of which only the first spot (0) is the real data (should be reprocessed from CMS) • 2012 data [/2012_10_12_H8_protons/Data1] [/2012_10_12_H8_protons/Data2][/TB_22_06_2012_recodata] • Tree optimized and “performant” • But run collected in different folder • data in [/TB_22_06_2012_recodata] is in a tree 2011 like • Issue : several run is missing, so some crystals are unanalyzable R. Rossi - H8 crystal data analysis
Missing re-recoData 2010 Missing angular scan Missing Hi stat ch Bad Angular Scan Moving backward R. Rossi - H8 crystal data analysis
DechannelingLength ± 10 μrad R. Rossi - H8 crystal data analysis
2010 R. Rossi - H8 crystal data analysis
2012 R. Rossi - H8 crystal data analysis
Angle Scan Run Analysis • Angular scan of the crystal, moving the goniometer on the horizontal plane respect to the beam • We obtain both the scan of the angular kick with respect to the impact x angle and the goniometer position • From the second one we get three stripes in which each effect is quite evident, and we analyze the peak of AM, CH and VR • NB : That’s only a check, befor torsion correction, so we don’t know jet what is the impact angle respect the crystallographic plane. So for each stripes all the beam divergence is accepted. R. Rossi - H8 crystal data analysis
STF50 x deflection vs. impact angle x Down here is subtracted the initial angle scan of the goniometer R. Rossi - H8 crystal data analysis
STF50 x deflection vs. the goniometer position on the horizontal plane. Down here is subtracted the initial angle scan of the goniometer Slice selected for the analysis AM CH VR R. Rossi - H8 crystal data analysis
Peak AM CH VR R. Rossi - H8 crystal data analysis
Agnle Scan Analysis Recap From HiStat CH To do Note – VR sigma should be 1,387 μrad, which have to be added to the AM spread. R. Rossi - H8 crystal data analysis
Hi Stat CH analysis Strip geometrical cut Angular kick as function of x and y impact point is measured • The x cut is performed where a deflection appear in x deflection and where a spread due to multiple scattering appear in the y deflection plot. • Most of the case the y height of the crystal contains the y dimension of the beam • y cut : ± 3 σ from the mean of the y beam profile R. Rossi - H8 crystal data analysis
QM cut We measure the channeling efficiency (#ch/#tot) versus the impact point on the plane xy note : • We get a pixeled map of the xy plane. Each pixel have as dimension the spatial tracker resolution (50/60 μm) • For each pixel we analize the 1dim histogram of the angular kick inferred to each particle. A gaussian fit is performed around the CH peak • The channeling event are measured in two different way, depending on the crystal bending • Bending > 90 μrad : event counted inside the 3 σ from the mean of the fit • Bending ~ 50 μrad: gaussian fit integral (because of the overlapped events in the tail) R. Rossi - H8 crystal data analysis
QM cut We get a map of the channeling efficiency in each pixel. Then we chose a zone where the efficiency is higher then 0.5 and with a minimal fluctuation QMP27 x = [-0,4 ; 0,0] y = [-1,5 ; 1,5] R. Rossi - H8 crystal data analysis
Torsion correction STF47 R. Rossi - H8 crystal data analysis
Channeling Efficiency ± 2.5 μrad Efficiency = 0,74 R. Rossi - H8 crystal data analysis