Download
1 / 34
340 likes | 481 Views
March 20, 2014 Informational Text: Text Features H omework: I Ready! Ob jective: I can recognize text features of informational texts. Wa rm Up (in your composition book) C opy your objective into you comp book.

E N D
March 20, 2014 Informational Text: Text Features Homework: I Ready! Objective: I can recognize text features of informational texts. Warm Up (in your composition book) Copy your objective into you comp book. Turn to pg. R3 in your Lit book. Copy the definitions for INFORMATIONAL TEXT and TEXT FEATURES into your comp book.
Informational text writing that provides factual information. http://s.twistynoodle.com/img/r/book/informational-text/informational-text_coloring_page_png_468x609_q85.jpg?ctok=20111213180648
Text features design elements of a text that indicate its pattern of organization or otherwise make its central ideas and information understandable. titles sub / headings boldfaced type bulleted and numbered lists graphic aids - charts, graphs, illustrations, photographs, diagrams, maps and timelines.
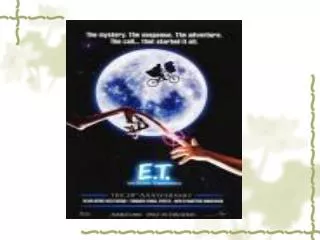
The Pyramid Builders 1. What is the second subheading following the title? 2. What is a dynasty? 3. Which text feature tells you about the structures shown in the photograph? http://debrakristi.files.wordpress.com/2012/01/pyramids_of_giza_egypt.jpg
Graphic aids visual representations of verbal statements that make complex information easy to understand. They are often used to organize, simplify and summarize information for easy reference. http://img.docstoccdn.com/thumb/orig/43981699.png
Graph a drawing that shows the relative values of numerical quantities.
circle (pie) graph shows the relationship of parts to a whole. The entire circle equals 100% and the parts of the circle represent percentages of the whole https://www.schoology.com/system/files/attachments/page_embeds/m/2013-05/pie.gif
line graph shows changes in numerical quantities over time and can be used to present trends such as global temperature change. http://www.mathgoodies.com/lessons/graphs/images/line_example3.jpg
bar graph vertical or horizontal bars are used to show or compare categories of information. The lengths of the bars indicate quantities. http://getwordwall.com/Attachments/Screenshots/Play/bar-graph.png http://studyzone.org/testprep/math4/d/bargra1.gif
diagram a drawing that shows how something works or how its parts relate to one another. http://upload.wikimedia.org/wikipedia/commons/e/e5/Diagram_of_the_human_heart_(cropped).svg
schematic diagram lines, symbols and words are used to help readers visualize processes or objects they wouldn't normally be able to see . http://upload.wikimedia.org/wikipedia/en/3/32/Schematic_diagram_standing_wave_systems.jpg
chart presents information, shows a process or makes comparisons, usually in rows or columns. http://media-cache-ec0.pinimg.com/236x/9a/b6/49/9ab6497fa8ef1aef42557ee520df8aab.jpg
table a specific type of chart that present a collection of facts in rows and columns and shows how the facts relate to one another. http://www.databison.com/wp-content/uploads/2009/09/chart-table-with-chart.png
map visually represents a geographic region, such as a state or country. It provides information about areas through lines, colors, shapes and symbols. http://upload.wikimedia.org/wikipedia/commons/b/b3/World-map-2004-cia-factbook-large-1.7m-whitespace-removed.jpg
political map shows political features, such as national borders. http://www.vidiani.com/maps/maps_of_europe/detailed_political_map_of_europe.jpg
physical map shows the landforms in an area.
road or travel map shows roads and highways. http://geology.com/cities-map/map-of-north-carolina-cities.gif
thematic map shows information on a specific topic, such as climate, weather or natural resources. http://3.bp.blogspot.com/-RDWM01wSb4Y/T3o63Qi8N3I/AAAAAAAAAGs/Uh-jg1I0Cig/s1600/choro.jpg
timelines shows events in the order in which they occurred. Event are listed along a horizontal or vertical line and are usually labeled with the year in which they happened. http://www.wiinintendo.net/wp-content/uploads/2009/12/video-game-timeline.jpg
1. According to the circle graph, is more glass or plastic recycled? Justify your answer.
2. For how many years did the average global temperature decrease?
3. According to the bar graph, what was the approximate are of Babylonia?
4. How many chambers did the Great Pyramid of Khufu contain?
5. What did the coil in Archimedes' water-lifting device do?
6. Use the chart to find the name of the Roman god of the sea.
7. According to the train schedule, if you took the 7:25 A.M. train from Crawford Square, when would you arrive at Quincy Station?
9. According to the thematic map of Australia, what part of the country has the highest risk of desertification?
10. Use the information in the timeline to make a prediction about what might happen in May 1861.
Turn to The Passamaquoddy on pg. 720. What kind of graphic aids do you see here? Read and answer the questions under sidebars A and B.
Which features does this map include? What information from this article does this map illustrate? What else do you learn about the lands of the Passamaquoddy from this map?
What does this timeline tell you about the Passamaquoddy that you don't learn from the article itself? What important information would you miss if you did not read this timeline?
Homework: I Ready!