Download
1 / 11
110 likes | 230 Views
ET: 3.4a. There is a company that decides to start putting some of their money into advertizing. The company records profits when varying amounts of money is used to purchase advertising. Make some observations based on the graph. . Profits are still increasing but at a slower rate .

E N D
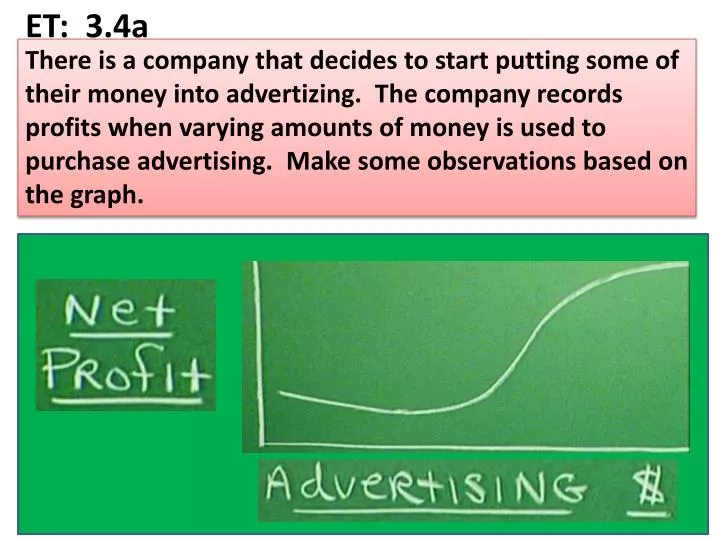
ET: 3.4a There is a company that decides to start putting some of their money into advertizing. The company records profits when varying amounts of money is used to purchase advertising. Make some observations based on the graph.
Profits are still increasing but at a slower rate Interpret the slope of the tangent: YES Net Profit NO YES ___Profit____ Advertising $ Inflection point Advertising $ What would you expect to happen to profit as the co. spends more $ on advertising? Increased Profit Does the profit increase for every additional advertising $? No? Does that mean that the advertizing didn’t generate any profit? Maybe, or just not much compared to the adv. Cost. Steeper (more profit/adv. $) Compare yes/yes Less Steep (less profit/adv. $)
Given f(x) Graph f’(x) Local max/min x-intercepts Negative slope below x-axis Positive slope above x-axis Point of inflection max or min
Given f(x) Graph f’(x) f(x) f’’(x) f’(x) Local max/min x-intercepts Positive slope above x-axis Negative slope below x-axis Point of inflection
f(x) f’’(x) f’(x) Finding point of inflection: A point of inflection is where the graph changes concavity. Plot critical point on # line and test value to left & right and see if both positive or both negative. f’’(x) = 0
Observation f(x) vs. f’’(x) f(x) f’’(x) f’(x) “cup up” f(x) is concave up f’’(x) is above the x-axis “frown down” f(x) is concave down f’’(x) is below the x-axis
X = -2 Min f’’(-2)= + X = 0 Max f’’(0)= - Candidates for relative maxs & mins X = 2 Min f’’(2)= +
Second Derivative Test So… try something else.
3 is in the interval which is concave up so it is a relative minimum. We could also tell because f’’(3) = + Possible Max/Mins Possible Inflection points 0 is not in any interval. f’’(0)= 0 which is not distinctly positive or negative so the test fails. Point of inflection at x = 0
Points of Inflection: Change in concavity Just because f’’=0 it doesn’t guarantee a point of inflection. y = x4 f’’(0)=0 yet x=0 is not a point of inflection
3.4 Assignments • 1-51 odd • 62, 65, 70, 91-94