Download
1 / 18
180 likes | 320 Views
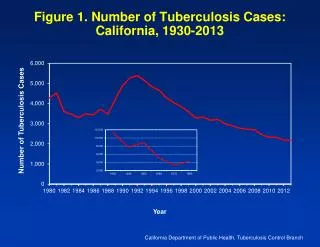
Figure 1. Number of Tuberculosis Cases: California, 1930-2013. Number of Tuberculosis Cases. Year. California Department of Public Health, Tuberculosis Control Branch. Number of Cases Case Rate per 100,000 Population National Case Rate (3.0 per 100,000).

E N D
Figure 1. Number of Tuberculosis Cases: California, 1930-2013 Number of Tuberculosis Cases Year California Department of Public Health, Tuberculosis Control Branch
Number of Cases Case Rate per 100,000 Population National Case Rate (3.0 per 100,000) Figure 2. Number of Tuberculosis Cases and Case Rates: California, 2004-2013 Number of Cases Case Rate per 100,000 • * * California Department of Public Health, Tuberculosis Control Branch
Figure 3. Tuberculosis in California, 2013 Tuberculosis Case Rates per 100,000 Population: California, 2013 > 5.7 (state average) 3.0- 5.7 < 3.0 (national average) < 5 cases Note: The map illustrates tuberculosis case rates by reporting jurisdiction in 2013. Thirteen jurisdictions (including Long Beach, not represented) had tuberculosis case rates above the state average of 5.7 cases per 100,000 population. Seven jurisdictions had tuberculosis case rates below the 2013 national rate of 3.0 per 100,000 population. Thirteen jurisdictions (including Pasadena and Berkeley, not represented) had case rates between the national and state rates (3.0 to 5.7 cases per 100,000 population). Case rates were not calculated for 28 jurisdictions because there were fewer than five cases in these areas. California Department of Public Health, Tuberculosis Control Branch
Figure 4. Tuberculosis Cases by Race/Ethnicity: California, 2013 American Indian/ Alaska Native 4 (0.2%) Black 137 (6.3%) White 182 (8.4%) Asian/Pacific Islander 1,063 (49.0%) Hispanic 783 (36.1%) California Department of Public Health, Tuberculosis Control Branch
Figure 5. Tuberculosis Case Rates by Race/Ethnicity: California, 2004-2013 Cases per 100,000 California Department of Public Health, Tuberculosis Control Branch
Figure 6. Tuberculosis Cases in Foreign-bornand U.S.-born Persons: California, 2004-2013 Percent of Cases Numberof Cases California Department of Public Health, Tuberculosis Control Branch
Figure 7. Tuberculosis Cases by Country of Origin: California, 2013 Unknown 5 ( 0.2%) U.S.-born 469 (21.6%) Foreign-born 1,695 (78.1%) All Others 422 (24.9%) Mexico 454 (26.8%) India 93 (5.5%) Philippines 380 (22.4%) China 147 (8.7%) Vietnam 199 (11.7%) California Department of Public Health, Tuberculosis Control Branch
Numberof Cases Percent of Cases Figure 8. Tuberculosis Cases in Persons 0-4 Years of Age: California, 2004-2013 Number of Cases Percent of Cases 2004 2005 2006 2007 2008 2009 2010 2011 2012 2013 Year California Department of Public Health, Tuberculosis Control Branch
Figure 9. Tuberculosis Cases by Verification Criteria: California, 2013 Positive Smear 10 (0.5%) Provider Diagnosis 80 (3.7%) NAAT* 44 (2.0%) Clinical Case 279 (12.9%) Positive Culture 1,756 (81.0%) *NAAT= Nucleic Acid Amplification Test California Department of Public Health, Tuberculosis Control Branch
Died During Treatment Died Before Starting Treatment Dead at Diagnosis Percent Dying with Tuberculosis Figure 10. Deaths in Persons with Tuberculosis: California, 2002-2011 Percent of Cases Numberof Deaths California Department of Public Health, Tuberculosis Control Branch
Figure 11. Tuberculosis Cases by HIV/AIDS Diagnosis*: California, 2003-2012 Number of Tuberculosis Cases with HIV/AIDS Percent of Tuberculosis Cases with HIV/AIDS Number of Cases with HIV/AIDS Percent of Cases with HIV/AIDS * Match found in HIV/AIDS Registry, California Office of AIDS California Department of Public Health, Tuberculosis Control Branch
Figure 12. HIV/AIDS-associated Tuberculosis* by Race/Ethnicity: California, 2003-2012 Number of Cases with HIV/AIDS * Match found in HIV/AIDS Registry, California Office of AIDS California Department of Public Health, Tuberculosis Control Branch
Figure 13. Tuberculosis Cases with Multidrug Resistance (MDR) on Initial or Final Drug Susceptibility Testing*: California, 2002-2011 Initial Susceptibility Test Final Susceptibility Test 43 41 37 36 36 34 33 32 Number of MDR Tuberculosis Cases 28 24 *Cases with resistance to at least isoniazid and rifampin reported on the Initial Drug Susceptibility Report (Follow-up 1) or on the Case Completion Report (Follow-up 2) California Department of Public Health, Tuberculosis Control Branch
Figure 14. Tuberculosis Cases with Initial Multidrug Resistance (MDR)*: California, 2009-2013 Initial MDR Cases: 2009-2013 ³ 25 Cases 15-24 Cases 5-14 Cases 1-4 Cases None Berkeley San Francisco Pasadena Long Beach *Cases with initial drug resistance to at least isoniazid and rifampin California Department of Public Health, Tuberculosis Control Branch
Figure 15. Tuberculosis Cases1 by Outcome of Therapy: California, 2011 No Information 18 (0.8%) Lost3 22 (1.0%) Other/Unk 85 (3.8%) Refused 18 (0.8%) Died 171 (7.6%) Completed Therapy >12 Months 271 (12.0%) Completed Therapy £12 Months 1,669 (73.8%) 1 Patient was alive at diagnosis and started on an initial drug regimen of two or more drugs. 2 Patient moved to another jurisdiction with a known forwarding address before treatment was completed; final outcome not available. 3 Patient could not be located prior to the completion of treatment. California Department of Public Health, Tuberculosis Control Branch
Figure 16. Outcome in Tuberculosis Cases for Whom One Year or Less of Treatment was Indicated1: California, 2011 Lost3 22 (1.0%) No Information 16 (0.7%) Refused 18 (0.8%) Other/Unk 81 (3.6%) Adverse Effect Of Therapy 7 (0.3%) Died 170 (7.7%) CompletedTherapy >12 Months 239 (10.8%) Completed Therapy £ 12 Months 1,669 (75.1%) 1 Excludes cases with rifampin resistant disease, cases with meningeal disease, and cases less than 15 years of age with disseminated tuberculosis disease. 2 Patient moved to another jurisdiction with a known forwarding address before treatment was completed; final outcome not available. 3 Patient could not be located prior to the completion of treatment. California Department of Public Health, Tuberculosis Control Branch
Figure 17. Outcome in Tuberculosis Cases for Whom Greater than One Year of Treatment was Indicated1: California, 2011 No Information 2 (5.1%) Died 1 (2.6%) Other/Unk 4 (10.3%) Completed Therapy >12 Months 32 (82.1%) 1 Includes cases with rifampin resistant disease, cases with meningeal disease, and cases less than 15 years of age with disseminated tuberculosis disease. 2Patient moved to another jurisdiction with a known forwarding address before treatment was completed; final outcome not available. California Department of Public Health, Tuberculosis Control Branch
Completed in 1 year or less Completed Figure 18. Completion of Tuberculosis Therapy: California, 2002-2011 Note: Excludes cases with rifampin resistant disease, cases with meningeal disease, cases less than 15 years of age with disseminated tuberculosis disease, and those that died during treatment. California Department of Public Health, Tuberculosis Control Branch