
Immune Reconstitution and T Cell Dynamics Post-Transplantation in Patients: A Comparative Study
This study examines immune reconstitution in patients post-nonmyeloablative stem cell transplantation (NST), focusing on CD3+, CD4+, and CD8+ T lymphocyte populations. We monitored recovery and specific CD4+ T cell subsets in 20 patients compared to 20 healthy controls. Significant findings include marked decreases in CD4+CD25highCD45RO+ regulatory T cells and increases in CD4+CD28+CD45RO+ T cells post-transplantation. Analysis of chimerism trends post-transplant sheds light on immune changes and responses associated with donor lymphocyte infusions and subsequent disease outcomes.

Immune Reconstitution and T Cell Dynamics Post-Transplantation in Patients: A Comparative Study
E N D
Presentation Transcript
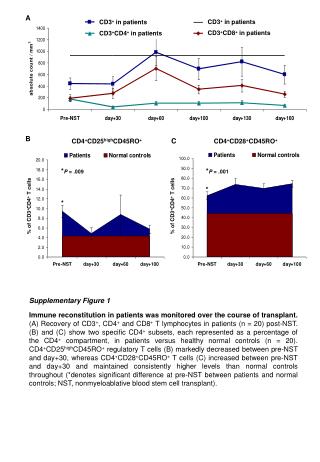
A CD3+ in patients CD3+ in patients CD3+CD8+ in patients CD3+CD4+ in patients B C CD4+CD25highCD45RO+ CD4+CD28+CD45RO+ *P = .009 *P = .001 * * % of CD3+CD4+ T cells % of CD3+CD4+ T cells Supplementary Figure 1 Immune reconstitution in patients was monitored over the course of transplant. (A) Recovery of CD3+, CD4+ and CD8+ T lymphocytes in patients (n = 20) post-NST. (B) and (C) show two specific CD4+ subsets, each represented as a percentage of the CD4+ compartment, in patients versus healthy normal controls (n = 20). CD4+CD25highCD45RO+ regulatory T cells (B) markedly decreased between pre-NST and day+30, whereas CD4+CD28+CD45RO+ T cells (C) increased between pre-NST and day+30 and maintained consistently higher levels than normal controls throughout (*denotes significant difference at pre-NST between patients and normal controls; NST, nonmyeloablative blood stem cell transplant).
Late PR day+662 % Donor Chimerism Late PR day+129 Late PR day+101 Days after transplantation Supplementary Figure 2 Chimerism trends in the ten responders (seven with partial response, PR and three with stable disease, SD) shown in relation with DLI infusions (indicated by arrows over the graph). The horizontal bar below each graph represents the post-transplantation timeline for the responder showing critical events including onset of regression (indicated by a triangle), removal of cyclosporin (indicated by an oval), and onset of GVHD (indicated by a diamond). Late response timepoints are also shown (“late PR” in patients 7, 16 and 19).