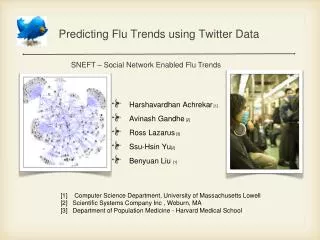
Predicting Flu Trends using Twitter Data
Predicting Flu Trends using Twitter Data. SNEFT – Social Network Enabled Flu Trends. Harshavardhan Achrekar [ 1 ] Avinash Gandhe [ 2 ] Ross Lazarus [3] Ssu-Hsin Yu [2] Benyuan Liu [ 1 ].

Predicting Flu Trends using Twitter Data
E N D
Presentation Transcript
Predicting Flu Trends using Twitter Data SNEFT – Social Network Enabled Flu Trends • Harshavardhan Achrekar [1] • Avinash Gandhe [2] • Ross Lazarus [3] • Ssu-Hsin Yu[2] • Benyuan Liu [1] [1] Computer Science Department, University of Massachusetts Lowell[2] Scientific Systems Company Inc , Woburn, MA[3] Department of Population Medicine - Harvard Medical School
Outline • Background • Related Work • Our Approach • SNEFT System Architecture • Twitter Dataset Description • Twitter Dataset Analysis • Conclusion
Seasonal flu • Influenza (flu) is contagious respiratory illness caused by influenza viruses. • Seasonal - wave occurrence pattern. • 5 to 20 % of population gets flu • ≈ 200,000 people are hospitalized from flu related complications. • 36,000 people die from flu every year in USA. • worldwide death toll is 250,000 to 500,000. • Epidemiologists use early detection of disease outbreak to reduce no. of people affected • CDC collects Influenza-like Illness (ILI) from its surveillance network and publishes weekly (usually 1-2 weeks delay)
Related Work :- Google Flu Trends • Certain Web Search terms are good Indicators of flu activity. • Google Trends uses aggregated search data on flu indicators. • Estimate current flu activity around the world in real time. • From example :- Google Flu Trend detects increased flu activity two weeks before CDC. Link:- www.google.com/flutrends CDC stands for Center for Disease Control
Our Approach • OSN emerged as popular platform for people to make connections, share information and interact. • OSN represent a previously untapped data source for detecting onset of an epidemic and predicting its spread. • {“i am down with flu”, “got flu.”} msg exchange between users provide early ,robust predictions. • Twitter/Facebook mobile users tweet/posts updates with their geo-location updates. helps in carrying out refined analysis. • User demographics like age, gender, location, affiliated networks.,etc can be inferred from data. • snapshot of current epidemic condition and preview on what to expect next on daily or hourly bases. User Population (in millions) • FaceBook:- 600 • Twitter:- 200
System Architecture of SNEFT Data Collection Engine ILI Pre-diction ILIData ARMA Model downloader Internet Flu Warn-ing NoveltyDetector crawler OSNData State Esti-mate Filter / Predictor OSN models Math models ILI stands for Influenza-Like Illness
OSN Data Collection Design of the Twitter data collection engine / Crawler
Twitter Data Set • Real Time Response Stream fetches entries relevant to searched keyword having the tweets in reverse-time order. • Data collection active from October 18, 2009 until present. • Until October 23, 2010 we have collected 4.7 million tweets from 1.5 million unique users. • CDC’s Inactive ILI period last from May 23, 2010 to October 9, 2010, • Results in 31 weeks of CDC data available for comparison with Twitter dataset.
Spatio Temporal Database for Twitter Data Set • Crawler uses Streaming Real time Search Application Programming Interface (API) to fetch data at regular time intervals. A tweet has the • Twitter User Name, • the Post with status id • Time stamp attached with each post. • From Twitter’s username we can get profile details attached to every user which include • number of followers, • number of friends, • his/her profile creation date, • location {public or private from the profile page or mobile client} • with status updates count • User’s current location is passed as an input to Google’s location based web services to get geo-location codes (i.e., latitude and longitude) along with the country, state, city with a certain accuracy scale.
Twitter Data Set Analysis • 30.6% users are from USA, • 41.3% users are outside USA • 28.1% users have not published their location details. State-wise Distribution of USA users on Twitter for flu postings
Twitter Data Set Analysis • Figure shows percentage of unique Twitter users who mentioned about flu in tweets at different hours of the day. • The hourly activity patterns observed at different hours of the day are much to our expectations, with high traffic volumes being witnessed from late morning to early afternoon and less tweet posted from midnight to early morning, reflecting people’s work and rest hours within a day. • Average daily usage pattern within a week suggests a trend on OSN sites with more people discussing about flu on weekdays than on weekends. Hourly Twitter usage pattern in USA Average daily Twitter usage within a week
Twitter Data Set Cleaning • Retweets: A retweet is a post originally made by one user that is forwarded by another user. • Syndrome elapsed time: An individual patient may have multiple encounters associated with a single episode of illness . To avoid duplication the first encounter for each patient within any single syndrome group is reported to CDC, but subsequent encounters with the same syndrome are not reported as new episodes until more than six weeks has elapsed since the most recent encounter in the same syndrome. We call it syndrome elapsed time. • Remove retweets and tweets from the same user within a certain syndrome elapsed time, since they do not indicate new ILI cases.
Twitter Data Set Analysis Number of Twitter users per week versus percentage of weighted ILI visits by CDC • Increase in number of users tweeting about flu related activity is accompanied by increase in the percentage of weighted ILI visits reported by CDC in the same week.
Scaling the Number of Twitter Reports • . • The number of Twitter users has increased significantly over the period of interest • Weekly Twitter Usage (number of tweets per week) used for scaling flu related tweet counts
Twitter Data Set Analysis Percentage of weighted ILI visits by CDC, original Scaled Twitter dataset and Scaled Twitter dataset filtered by retweets and syndrome elapsed time of one week displayed on weekly basis
Prediction Model Auto Regressive model with external input (Twitter data) • y(t) : percentage of physician visits due to ILI in week t • u(t): number of unique Twitter users with flu related tweets in week t • e(t): sequence of independent random variables • c : a constant term to account for offset.
Prediction Model • To predict the flu cases in week t using the ARX model based on the CDC data with 2 weeks of delay and/or the up-to-date Twitter data, we use • ˆy(t): predicted CDC data in week t.
Cross Validation Results Root mean squared errors from 5-fold cross validation • addition of Twitter data improves the prediction with past CDC data alone • use of Twitter data alone to predict the ILI rates (m = 0) results in poor predictions • high Twitter activity during the swine flu outbreak was likelyexaggerated by panic, media coverage, searches for vaccines in short supply, etc. • using Twitter data alone is insufficient for prediction and that the past ILI rates are critical in predicting future values, as evidenced by our results
Regional & Age-based Flu Prediction Analysis • ILI seems to peak later in the northeast (Regions 1 and 2) than in the rest of the country • by at least week. The Twitter reports also follow this trend. • In Region 9 (CA, NV, AZ …), Region 4 (FL, etc.) and the northeast, the ILI rates seem to • drop off fairly slowly in the weeks immediately following the peaks. This is also • reflected in the Twitter reports. • Approximately 20-25 weeks after the peak ILI, the northern regions have lower levels • relative to the peaks than the southern regions. This is also true of the Twitter reports.
Regional & Age-based Flu Prediction Analysis Prediction performance (mean-squared error) • Twitter data fits the age-groups 5-24 yrs best, correlates well with the fact that this is likely the most active age groups using OSN • significant difference seems to be in Region 1 (the northeast) where the Twitter activity best fits ILI activity amongst the 0-4 yrs age group
Conclusions • Investigated the use of a previously untapped data source, namely, messages posted on Twitter to track and predict influenza epidemic situation in the real world. • Results show that the number of flu related tweets are highly correlated with ILI activity in CDC data • Build auto-regression models to predict number of ILI cases in a population as percentage of visits to physicians in successive weeks. • Tested our regressive models with the historic CDC data and verified that Twitter data effectively improves model’s accuracy in predicting ILI cases. • Opportunity to significantly enhance public health preparedness among the masses for influenza epidemic and other large scale pandemic.
Future Work • Identify most appropriate keywords for our OSN crawlers • classification on the tweets to identify real flu events • identify a robust way of scaling the number of influenza related OSN reports to the total activity on a particular OSN service in order to account for seasonal fluctuations in activity in use of the network or due to changes in popularity of a particular service • looking at users and their friend’s interactions to understand the spread of flu within their social networks.