
Uploaded by
fisk
1 SLIDES
128 VIEWS
10LIKES
Comparative Analysis of NGC 2903 Nucleus: Our Data vs. Prabhu (1979)
DESCRIPTION
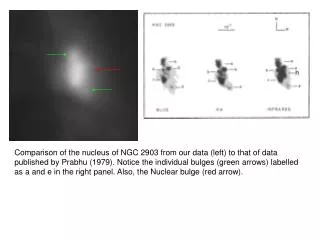
This study presents a comparison of the nucleus of NGC 2903 using our newly acquired data (left panel) and the results published by Prabhu in 1979 (right panel). Key features highlighted include the individual bulges marked by green arrows, labeled as 'a' and 'e', as well as the notable nuclear bulge indicated by a red arrow. This analysis aims to provide deeper insights into the structural components of NGC 2903 and assess changes or consistencies over the years in observational data.
Download
1 / 1
Download Presentation 
Comparative Analysis of NGC 2903 Nucleus: Our Data vs. Prabhu (1979)
An Image/Link below is provided (as is) to download presentation
Download Policy: Content on the Website is provided to you AS IS for your information and personal use and may not be sold / licensed / shared on other websites without getting consent from its author.
Content is provided to you AS IS for your information and personal use only.
Download presentation by click this link.
While downloading, if for some reason you are not able to download a presentation, the publisher may have deleted the file from their server.
During download, if you can't get a presentation, the file might be deleted by the publisher.
E N D
Presentation Transcript
Comparison of the nucleus of NGC 2903 from our data (left) to that of data published by Prabhu (1979). Notice the individual bulges (green arrows) labelled as a and e in the right panel. Also, the Nuclear bulge (red arrow).
More Related