Download
1 / 41
410 likes | 519 Views
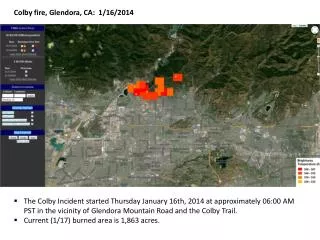
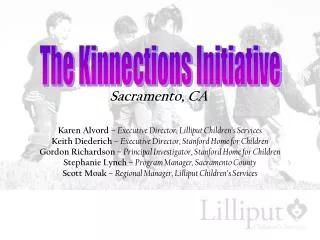
Assessing and Managing Social Risks Branda Nowell and Toddi Steelman north Carolina state university branda.nowell@ncsu.edu 919 513 1768 Toddi.steelman@usask.ca. CA Fire Leadership Meeting Sacramento, CA April 4, 2014. Social Risk Assessment and Management of Incident Networks.

E N D
Assessing and Managing Social RisksBranda Nowell and Toddi Steelmannorth Carolina state universitybranda.nowell@ncsu.edu 919 513 1768 Toddi.steelman@usask.ca CA Fire Leadership Meeting Sacramento, CA April 4, 2014
Social Risk Assessment and Management of Incident Networks • Rising expectations about who will be involved in a complex wildfire incident • Cohesive strategy goals– • Efficient and effective response to shared-jurisdiction wildfire • Pre-fire planning for multiple jurisdictions • Metrics include pre-season agreements and annual operating plans, integrated wildfire response scenarios, and sharedtraining • More holistic and system focus regarding both WHO we consider part of incident response and WHAT we consider as part of incident response
Fire management Road Closures
Fire management Evacuations Road Closures
Fire management Evacuations Sheltering & Mass Care Road Closures
Fire management Public Information Evacuations Sheltering & Mass Care Road Closures
Fire management Interagency Communications Public Information Evacuations Sheltering & Mass Care Road Closures
Fire management Interagency Communications Public Information Cost Share Evacuations Sheltering & Mass Care Road Closures
Fire management Interagency Communications Public Information Cost Share Evacuations Sheltering & Mass Care Road Closures Politicians
Incident Performance for Fire Season 2013:How did we do? • Type 1 and Type 2 WUI Fires • ID, OR, WA, and MT (+ one pilot in CO) • Total of 22 incidents • Network Performance scale (Nowell & Steelman, 2012) • 28 items • Interview and observation data from three incidents: • GC Complex (OR) , Elk (ID), and Beaver Creek (ID) fires
2013 incident Performance by Domain 1= strongly disagree 3 = neither agree/disagree 5 = strongly agree Lower Performance Strongest Performance
Fire management Interagency Communications Public Information Cost Share Evacuations Sheltering & Mass Care Road Closures Politicians
Social Risk Assessment and Management Within Incident Networks • Relationships critical VAR • More complex array of responders = greater risk • How do we understand and manage these relationships and these risks?
How do we assess and manage greater social risk? • Need tools to help gain better situational awareness and mental maps for assessing and managing social risk
A Brief Introduction to Social Networks What is a network?
Fire management Interagency Communications Public Information Cost Share Evacuations Sheltering & Mass Care Road Closures Politicians
THE WHO: Wildfire Incident Response as a Network Response IMT
Need To Think ABOUT an Incident in terms of the entire responder network IMT
How did IMTS DO? • IMT performance scores overall were good • Range between “A little room for improvement” to “Some room for improvement”
What areas did cooperators and host agencies view IMTs performing the best? Good Team Player • Acknowledging Cooperation • Sharing Credit with Your Agency • Staying in Their Lane Positive ambassador • Serving as a Positive Ambassador in Interactions Accessible • Being Accessible to You
Where did local cooperators and host agencies see the most room for improvement for IMT performance? Appreciating local context • Valuing local knowledge and local input • Being sensitive to the local community • Incorporating information about local values • Obtaining and utilizing information about the local context Pro-active communication • Including your agency in info dissemination • Getting your agency the info you need Early engagement of affected jurisdictions • Engaging affected jurisdictions from the beginning Flexibility • Being flexible in adapting their fire management strategy
IMT Performance Currently in a coordinating model, but getting a signal from other groups that they would like a more collaborative model
Host Agency as network broker IMT Local Community Host Agency
How did Host Agencies DO in 2013? • Host performance scores overall were very positive
Host Unit Performance • Best Performance • Providing effectively –engaged Agency Administrators • Providing up to date information on all pertinent media contacts • Demonstrating familiarity with how IMTs operate • Greater Room for Improvement • Good maps of values at risk • Contact information for pertinent local cooperators • Locations of residential populations that could be at risk
Key Finding: The better the host agency performs as a broker – the better the incident outcomes!
Social Risk Assessment and Management: Tools you can use • Watch Out Situations • SOCIAL WATCH OUTS
Watch Out Situations: What Did We learn? • Need to watch out for situations indicative of social risk • 2012/13 Interviewed 24 Fire Managers across 10 states • 646 years of large wildfire experience • 824 Type 1 Fires • 2013 AC/IC participants evaluated list • 2013 fire season surveyed for watch outs on 22 fires
FINDINGS 2013:Key Watch Out SituationsSituations that > 50% of respondents identified as present on their incident
Key Take Aways • Importance of developing broader situational awareness of incident response networks • Utilizing metrics for performance on incidents that tap into management of networks and mitigation of social risk through pro-active communication and coordination • Recognizing the critical role of host agencies in helping to bridge between the IMT and the local community • Watch out for Watch out situations • Watch out clusters– some kinds of risks happen together, • Think about watch outs in relation to IMT social capital
Discussion • What to do with this information • Training? • Venues for communication?