Download
1 / 1
10 likes | 102 Views
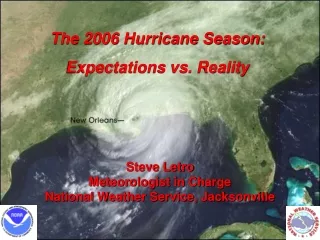
Explore the potential link between hurricane season and winter patterns, as hurricanes disrupt heat balance, leading to thermodynamic processes. Research shows a correlation between the number of re-curving tropical systems and winter temperatures in the U.S. Follow the findings to understand how an "inactive" hurricane season can affect weather patterns in the following winter.

E N D
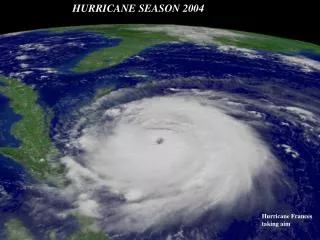
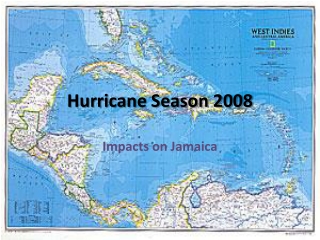
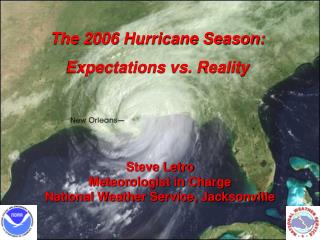
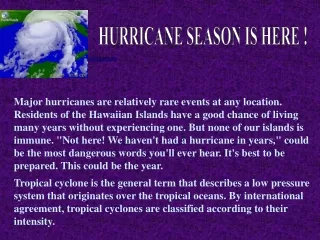
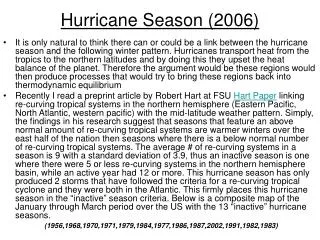
Hurricane Season (2006) • It is only natural to think there can or could be a link between the hurricane season and the following winter pattern. Hurricanes transport heat from the tropics to the northern latitudes and by doing this they upset the heat balance of the planet. Therefore the argument would be these regions would then produce processes that would try to bring these regions back into thermodynamic equilibrium • Recently I read a preprint article by Robert Hart at FSU Hart Paper linking re-curving tropical systems in the northern hemisphere (Eastern Pacific, North Atlantic, western pacific) with the mid-latitude weather pattern. Simply, the findings in his research suggest that seasons that feature an above normal amount of re-curving tropical systems are warmer winters over the east half of the nation then seasons where there is a below normal number of re-curving tropical systems. The average # of re-curving systems in a season is 9 with a standard deviation of 3.9, thus an inactive season is one where there were 5 or less re-curving systems in the northern hemisphere basin, while an active year had 12 or more. This hurricane season has only produced 2 storms that have followed the criteria for a re-curving tropical cyclone and they were both in the Atlantic. This firmly places this hurricane season in the “inactive” season criteria. Below is a composite map of the January through March period over the US with the 13 “inactive” hurricane seasons. (1956,1968,1970,1971,1979,1984,1977,1986,1987,2002,1991,1982,1983)