Download
1 / 37
370 likes | 560 Views
Jonathan Haskel Annarosa Pesole Imperial College Business School, Imperial College London. Productivity and Innovation in UK Financial Services: An Intangible Assets Approach. Financial services innovation. Important In what other industry has innovation destroyed all of Western capitalism?

E N D
Jonathan Haskel Annarosa Pesole Imperial College Business School, Imperial College London Productivity and Innovation in UK Financial Services: An Intangible Assets Approach
Financial services innovation • Important • In what other industry has innovation destroyed all of Western capitalism? • Innovation: controversial • Greenspan: very innovative, vg • Buffet: very innovative: vb • Volcker: only one useful innovation in financial services in 30 years • Empirical studies of financial services innovation • Cohen (1995) survey of innovation • books and articles = 357 • Of which, referring to financial services = • Thin on the ground: Frame/White JEcLit review, • Pre 1998: 6 • 1998-2004: 23
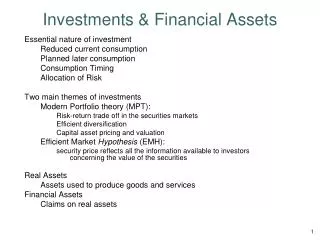
What is bank output? • Production function studies • Elyasiani and Mehdian (1990a, 1990b): • output = loans • input = deposits • Berger and Humphrey (1992), Prasad and Harker (1997) • output = (deposits + loans)
If we are not sure about output, try some other measures… • Patents in financial services • UK: 0 • US: Lerner (2002) • Feb71-Feb2000, 445 • Of which, in universities: 4 • (Coca Cola alone has 800 patents) • R&D • UK: BERD R&D intensity • Furniture manufacturing = 0.3% • Finance = 0.02% • US: Lerner (2006), • R&D in Citibank accounts, 1995-05 =0
Studies of financial innovation • Categorisation of innovations, Frame White (2004) • new products (e.g., subprime mortgages) or services (e.g., ATM, debit and pre-paid cards and internet banking for transactions). • new production processes e.g. credit scoring, electronic processing • new organizational forms (e.g., Internet-only banks). • Innovation counts of new products • Lerner (2002), new products via search for news stories in WSJ, 1990-2002 • Case studies
Studies of financial innov’n, contd • Tufano (1989) • 58 financial innovations, 1974-86, innovative corporate or mortgage-backed securities, from literature searches or industry experts. • Findings • Developing a new financial product requires “an investment of $50,000 to $5 million, which includes • (a) payments for legal, accounting, regulatory, and tax advice, • (b) time spent educating issuers, investors, and traders, • (c) investments in computer systems for pricing and trading, and • (d) capital and personnel commitments to support market-making. • In addition, investment banks that innovate typically pay $1 million annually to staff product development groups with two to six bankers.”. • Imitation of innovation very fast: • the mean number of days until a rival entered with an imitative product was 77.6 days and • 35 of the products surveyed were imitated within a year of initial marketisation.
Implications of innovation findings for growth accounting • Spillovers important • Fast entry Tufano (1989), no patents (Lerner, 2002). • Needs a framework which accommodates this, TFP • Innovation requires upfront investment wider than R&D • product development (which might be thought of as “R&D” in a manufacturing context) • but also • marketing, • Software • Training of staff • not captured by reported R&D • Innovation in organisational form • Importance of IT, • hardware and • software
Intangible approach to innovation • Intangible capital is knowledge capital from spending on knowledge • Knowledge spending categories • R&D (measured in practice as scientific) Plus • Software • Design and non-R&D product development • Branding and reputation • Firm-provided human capital • Organisational capital • Headings resonate with case studies • Rest of talk • Measurement • Results and implications of growth accounting
Output of a bank • Two views • Provision of finance: taking the supply of loanable funds e.g. from rural areas, to the demand in cities. • Underlies production function view loans= f(deposits) • Provision of financial services: • Safekeeping, transactions services • Loan services: screening • Transfer of risk • How to measure services? • Priced • Unpriced
A bank/ financial intermediary must offer depositors implicitly priced services, SD, In return that deposit their money YD, for one period and earn rDEP Alternative: put it elsewhere at market return to depositors of rM, D. Arbitrage condition YDt-1 (1+rMKT, D) = SDt + YDt(1+rDEP) So: SD = YD (rMKT,DEP -rDEP+D ) Measuring unpriced services to borrowers
Similar arbitrage condition YLt-1 (1+rMKT, L) = -SLt + YLt(1+rL) SL = YL (rL -rMKT,L +L ) So total value of bank services is VE+SL + SD =VE+YD (rMKT,DEP -rDEP+D )+YL (rL -rMKT,L +L) Implications Collect data on directly charged services Implicit charge inferred from margins Deflators UK uses GDP deflator, but adjusted for productivity Implicit services to lenders
Spending on R&D • Method • follow own-account software method • pick “knowledge occupations” from labour force data in financial services • Spending = (wage bill X overheads X fraction of time on research) • Knowledge occupations • Informed by interviews with banks on occupational classification of new product developers • Broad headings • Researchers (new products) • Software (new software) • Managers (organisational investment)
“R&D” spend in fin’l services • Software and manage spend dominates researcher spend, other very small. Suggests software and organisational capital likely important? • BERD look to understate R&D spend. • Relative to other sectors big ticket items in financial services are • Software • Organisational capital
Financial services, excluding intangibles • Capital deepening about 10% of FinSv LPG • Much Cap deepening from tangible ICT = hardware, accords with case studies • higher TFPG = most innovative? • TFPG/LPG= 48%, not much one can say about innovation, unless its all free knowledge spillovers
Financial services, including intangibles • Cap deepening now 25% of LPG, up from 10% • Capital deepening ½ tang and ½ intang • FinSvs still has highest TFPG • TFPG/LPG= 29%, down from 48% without intang
Conclusion • Relatively little work on financial services (patents, R&D absent) • What there is suggests: • Knowledge spillovers important • New financial products need investment and co-investment in • Training • IT (software, hardware) • Marketing • New organisational forms seem important e.g. internet only banks. Suggests investment in organisational capital • Intangibles framework • Calculates “wider” knowledge spending • Many measurement issues but results so far suggest: • Using this approach changes TFPG from around 50% of LPG to 31% of LPG • Raises capital deepening in financial services from 10% of LPG to 25% of LPG • ½ of that capital deepening is hardware • ½ is intangibles, of which 1/3rd software, 1/3rd organisational investment • Future work • Better measures of intangible investment, deflators, depreciation etc. • TFP with imperfect competition
Intangible spend • Emp’t and value added: fin svcs = ¼ to ½ size of manufacturing • Intangibles • Software, branding: fin svcs spends more or equal to manufacturing. Note 2006 software. • Org capital: fin svcs = ¾ of manufacturing • Training, design, R&D: figures more in proportion with manufacturing.
Research occupations(and 2008 employment) • Researchers (33,012) • “management consultants, actuaries, economists and statisticians” • Design and development engineers • Scientific researchers • Social Science researchers • Researchers nec • Other researchers” (5,042) • engineers • Bio scientists, chemists • Note we exclude SOC group 3, “financial technicians (brokers, analysts, adviser, etc)”, interviews show they do mostly sales • Software: follow ONS data (40,619) • Management (288, 224) • Bought in: consulting • Own account • “Financial Institution Managers” described as workers who “..plan, organise, direct and co-ordinate the activities and resources of banks, building societies, insurance companies and post offices”.
“R&D” spend in fin’l services • Base case: 1.6 overheads, 50% researcher time, 20% manag time, ONS software • Software and manage spend dominates researcher spend, other very small. Suggests software and organisational capital likely important? • DIUS scoreboard/BERD look to understate R&D spend.
Intangible spend • Emp’t and value added: fin svcs = ¼ to ½ size of manufacturing • Intangibles • Software, branding: fin svcs spends more or equal to manufacturing. Note 2006 software. • Org capital: fin svcs = ¾ of manufacturing • Training, design, R&D: figures more in proportion with manufacturing.
Financial services, excluding intangibles • Much Cap deepening from tangible ICT = hardware, accords with case studies • higher TFPG = most innovative? • TFPG/LPG= 48%, not much one can say about innovation, unless its all free knowledge spillovers
Financial services, including intangibles • Cap deepening almost equal between tang and intang • FinSvs still has highest TFPG • TFPG/LPG= 29%, down from 48% without intang
Intangible capital contribution by asset • Of intang capital deepening: • 1/3rd software • 1/3rd organisational
Conclusion • Subject: innovation, productivity and total factor productivity in financial services revisited • Relatively little work on financial services (patents, R&D absent) • What there is suggests: • Knowledge spillovers important • New financial products need investment in development but also co-investment in • Training • IT (software, hardware) • Marketing • New organisational forms seem important e.g. internet only banks. Suggests investment in organisational capital • Chosen method • Extended growth accounting • Calculating “wider” knowledge spending • software, training, marketing and organisational capital • Many measurement issues but results so far suggest: • Using this approach changes TFPG from around 50% of LPG to 31% of LPG • Raises capital deepening in financial services from 10% of LPG to 25% of LPG • ½ of that capital deepening is hardware • ½ is intangibles, of which 1/3rd software, 1/3rd organisational investment • Future work • Better measures of intangible investment, deflators, depreciation etc. • TFP with imperfect competition
Output in fin svcs Financial intermediaries: mostly banks
Output of a bank • Two views • Provision of finance: taking the supply of loanable funds e.g. from rural areas, to the demand in cities. • Underlies production function view loans= f(deposits) • Provision of financial services: • Safekeeping • Transactions services • Loan services: screening, • Transfer of risk • Underlies theory of banking: banks exist • To provide safeguarding services • because asym infor prevents savers lending directly to borrowers
Output of bank, contd • Usually we measure value by revenues generated e.g. sales of airtickets. • Main problem here: banks don’t charge explicitly for many services e.g. “Free” banking • So empirical question is to get value from implicit charges. • Total value is explicit + implicit service charges to lenders and depositors • V=VEXP+ SL+SD
A bank/ financial intermediary must offer its depositors a flow of implicitly priced services, SD, induce them to deposit their money YD, for a period with the bank not put it elsewhere at market return to depositors of rM, D. Arbitrage condition YDt-1 (1+rMKT, D) = SDt + YDt(1+rDEP) Where rDEP is the interest, which may be zero, offered by the bank to the depositors. Hence we can write the implicitly value of services offered to depositors SD as SD = YD (rMKT,DEP -rDEP+D ) Implicit services to borrowers
Similar arbitrage condition YLt-1 (1+rMKT, L) = -SLt + YLt(1+rL) SL = YL (rL -rMKT,L +L ) So total value of bank services is VE+SL + SD =VE+YD (rMKT,DEP -rDEP+D )+YL (rL -rMKT,L +L) Implicit services to lenders
total value of bank services is VE+SL + SD =VE+YD (rMKT,DEP -rDEP+D )+YL (rL -rMKT,L +L) Points Production function literature: are deposits/loans inputs or outputs? Neither, but value of services related to them National Accounts approach Define FISIM= YD (rF -rDEP )+YL (rL -rF), rF = risk-free SNA1993/post BB2008, Nat Accounts value bank svcs = VE+ FISIM Reconclies with approach here if Capital gains zero rMKT is risk-free rate Fine if bank can obtain its funds to lend at risk-free rate and depositors face rF as alternative to depositing If banks raises money from shareholders, then shareholders have to take risk, so banks have to pay for that. Hence FISIM overstates services to lenders because that margin also includes payments to shareholders Value of bank services
Some volumes collected directly e.g. insurance policies written FISIM deflated by GDP deflator VE = payments for explicit services, deflated by financial services average earnings index excluding bonuses adjusted for productivity In the data, 32% of sector J is deflated by this adjustment then everything else constant, real output in J grows by 0.27%pa Volume of financial services
Growth accounting • Purpose: investigate innovation in a structured way • Innovation can be defined any way: we suggest • effect on growth of commercialisation of new knowledge • New knowledge comes from own investment and spillovers of knowledge • Innovation = contribution of new knowledge to growth + TFPG • Without intang = • With intangibles
To measure • Nominal investment data on tangibles and intang’s • Perpetual inventory assumption • Needs deprecation and deflators • Rental price of assets from user-cost of capital theory plus profit exhaustion assumption
To measure, contd • Adjust GDP for intangibles • Intangibles used to be intermediates, now are investment • We have seen that income side rises, with extra (rental) payments for this income • And GDP on output side rises with extra investment • Allow for labour quality