Download
1 / 10
110 likes | 242 Views
This research project focuses on improving plasma tomography resolution using microwave technology and advanced algorithms developed by Prof. Yu A. Kravtsov and M.V. Tinin's research group. The innovative approach enhances resolution up to 5 mm, enabling precise electron density determination in plasma for turbulence studies.

E N D
Microwave Plasma Tomographyof Higher Resolution (project 1.2)Research group:Prof. Yu.A.Kravtsov, Institute of Physics, Maritime University of SzczecinProf.. M.V.Tinin and his colleagues from the Irkutsk State UniversityMsc. P. Berczyński, Institute of Physics, Szczecin University of TechnologyPotential partners: Dr.H.Bindslev, Denmark;Prof. H.Harfuss, Germany; Dr.H. Weisen (CRPP, Lozanna).
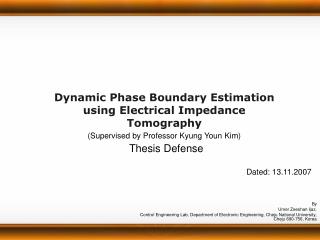
r0 z0 z Microwave Phase Tomography Phase shift due to inhomogeneities in plasma: r
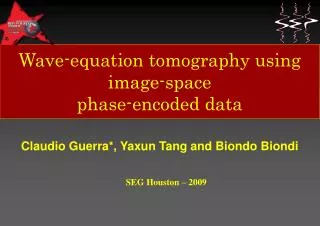
TRANSMITTERS H Conventional tomography RESOLUTION >150 mm H=5 m =5 mm RECEIVERS
Features of the conventional phase tomography: • RESOLUTION : >150 mm, when CAMERA HEIGHT is H~5m and wavelength is ~5 mm. • 2. High sensitivity to the amplitude fluctuations, which are inevitable due to plasma inhomogeneities.
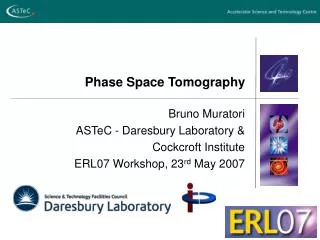
Plasma Tomography of higher resolution (Tinin,Kravtsov, Radio Sci., 2000) (wavelength) Quadratic phase correction warants focusing and highly improves resolution upto a wavelength (5 mm instead of >150 mm under conventional tomography)
Determining electron density Ne on the basis of Tinin method Doubly weighted Fourier transform Quadratic term, responsible for focusing Linear term responsible for Fourier transform => Ne (r)
Features of diffraction tomography byTinin • Strong amplitude fluctuation are now admissible 2. Higher resolution: δ~λH/D λ when D H. At H=5 m, λ=5 mm : δ λ=5 mm, Such resolution is sufficient for revealing peremeters of small-scale turbulence
Problems to solve: 1. To choose the optimal frequency (not too high, not too low). 2 Non-plane geometry of the camera and regular ihomogeneityof the electron density profile: tomographic algorithm, accounting both this factors is to be developed.
3. One can foresee comparatively low rate of the traditional „successive” tomographic procedure: when dealing with a matrix of 100x100 or 50x50 transmitters and receivers, supplied with phasemeters, it is necessary to do 10,000 or 2,500 phase measurements, so that parameters of the small-scale plasma turbulence may change. One of the methods to process with higher rate is to apply the „parallel” tomographic procedure, using different frequency for every pair of transmitter and receiver.
References • 1. Kravtsov Yu.A., Tinin M.V. Representation of the wave field in randomly inhomogeneous medium in the form of double weighted Fourier transform (DWFT). Radio Sci., 2000, 35(6), 1315-1322. • 2. Tinin M.V., Kolesnik S.N., Kravtsov Y.A. Integral representation for the field of the wave propagating in a medium with random inhomogeneities of different scales. Proc. SPIE, 2002, v. 4678, pp. 605-609. • 3. Kravtsov Yu.A. and Tinin M.V.. Ray based diffraction tomography of the Ionosphere and laboratory inhomogeneous plasma. Cosmic Researches 2003, 41(4), 357-358. • 4. Tinin M.V., Kim B.C., Kolesnik S.N. and Kravtsov Yu.A. Inhomogeneous structure of the Ionosphere plasma and accuracy of the satellite navigation system. Proceedings of the 2004 International Symposium on Antenna and Propagation (ISAP’04), August 17-21 2004, Sendai, JAPAN, paper POS-B-10, pp. 1105-1108.