Download
1 / 30
300 likes | 558 Views
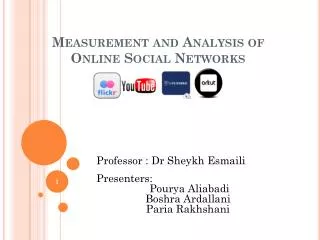
Measurement and Analysis of Online Social Networks. A. Mislove, M. Marcon, K Gummadi, P. Druschel, B. Bhattacharjee. Presentation by Shahan Khatchadourian Supervisor: Prof. Mariano P. Consens. Focus. graphs of online social networks how they were obtained how they were verified

E N D
Measurement and Analysis of Online Social Networks A. Mislove, M. Marcon, K Gummadi, P. Druschel, B. Bhattacharjee Presentation by Shahan Khatchadourian Supervisor: Prof. Mariano P. Consens Measurement and Analysis of Online Social Networks
Focus • graphs of online social networks • how they were obtained • how they were verified • how measurement and analysis was performed • properties of obtained graphs • why these properties are relevant Measurement and Analysis of Online Social Networks
Why study the graphs? • important to improve existing system and develop new applications • information search • trusted users • what is the structure of online social networks • what are different ways to examine a social network when complete data is not available? • how do they comparewith each other and to the Web? Measurement and Analysis of Online Social Networks
Which graphs? • Flickr, YouTube, LiveJournal, and Orkut • All are directed except for Orkut • Weakly Connected Component (WCC) • Strongly Connected Component (SCC) Measurement and Analysis of Online Social Networks
How are the graphs obtained? • API • users • groups • forward/backward links • HTML Screen Scraping Measurement and Analysis of Online Social Networks
Summary of graph properties • small-world • scale-free • correlation between indegree and outdegree • large strongly connected core of high-degree nodes surrounded by small clusters of low-degree nodes Measurement and Analysis of Online Social Networks
Crawling Concerns - Algorithms • BFS and DFS • Snowball method: underestimates number of low-degree nodes. In social networks, they underestimate the power-law coefficient, but closely match other metrics such as overall clustering coefficient. Measurement and Analysis of Online Social Networks
Crawling Concerns – FW links • cannot reach entire WCC Measurement and Analysis of Online Social Networks
How to Verify Samples • Obtain a random user sample • LJ: feature which returns 5,000 random users • Flickr: random 8-digit user id generation • Conduct a crawl using these random users as seeds • See if these random nodes connect to the original WCC • See what the graph structure of the newly crawled graph compares to original Measurement and Analysis of Online Social Networks
Crawling Concerns – FW links • no effect on largest WCC Measurement and Analysis of Online Social Networks
Crawling Concerns – FW links • increasing the size of the WCC by starting at a different seed Measurement and Analysis of Online Social Networks
Link Symmetry • even with directed links, there is a high level of symmetry • possibly contributed to by informing users of new incoming links • makes it harder to identify reputable sources due to dilution • possible sol: who initiated the link? Measurement and Analysis of Online Social Networks
Power-law node degrees • Orkut deviates: • only 11.3% of network reached (effect of partial BFS crawl – Snowball method) • artificial cap of user’s number of outgoing links, leads to a distortion in distribution of high degrees • differs from Web Measurement and Analysis of Online Social Networks
Power-law node degrees Measurement and Analysis of Online Social Networks
Power-law node degrees e.g. analysis of top keywords Measurement and Analysis of Online Social Networks
Spread of Information Measurement and Analysis of Online Social Networks
Power Law affectors • services, accessibility, features 100 100 mobile users 10-8 10-8 1 10000 1 10000 Measurement and Analysis of Online Social Networks
Correlation of indegree and outdegree • over 50% of nodes have indegree within 20% of their outdegree Measurement and Analysis of Online Social Networks
Path lengths and diameter • all four networks have short path length • Broder et al noted if Web were treated as undirected graph, path length would drop from 16 to 7, so what? Measurement and Analysis of Online Social Networks
Link degree correlations • JDD: joint degree distribution • mapping between outdegree and average indegree of all nodes connected to nodes of that outdegree • YouTube different due to extremely popular users being connected to by many unpopular users • Orkut shows bump due to undersampling Measurement and Analysis of Online Social Networks
Joint degree distribution and Scale-free behaviour cap on links undersampling of low-degree nodes celebrity-driven nature Measurement and Analysis of Online Social Networks
Densely connected core • removing 10% of core nodes results in breaking up graph into millions of very small SCCs • why an SCC? directed links matter for actual communication • graphs below show results as nodes are removed starting with highest-degree nodes (left) and path length as graph is constructed beginning with highest-degree nodes(right) Sub logarithmic growth Measurement and Analysis of Online Social Networks
Tightly clustered fringe • based on clustering coefficient • social network graphs show stronger clustering, most likely due to mutual friends Possibly because personal content is not shared Measurement and Analysis of Online Social Networks
Groups • group sizes follow power-law distribution • represent tightly clustered communities Measurement and Analysis of Online Social Networks
Groups • Orkut special case maybe because of partial crawl Measurement and Analysis of Online Social Networks
Node Value Determination • Directed Graph, current model • nodes with many incoming links (hubs) have value due to their connection to many users • it becomes easy to spread important information to the other nodes, e.g. DNS • unhealthy in case of spam or viruses • in order for a user to send spam, they have become a more important node, amass friends Measurement and Analysis of Online Social Networks
Node Value Determination • Link Initiator, requires temporal information • if user A requests a link with user B, does that mean that user B is more important? • even though graphs have a high level of link symmetry, this additional information can offset this symmetry • unfortunately, examined graphs do not have temporal information Measurement and Analysis of Online Social Networks
Trust • lendingclub.com, Facebook application • people are more willing to lend money to friends who are linked through a short path • people are more willing to pay back those who are linked through a short path • no indication of whether this actually works • does trust increase as degree increases? • what credit rating and JDD does a person have to get a good interest rate? Measurement and Analysis of Online Social Networks
Thank you shahan@cs Measurement and Analysis of Online Social Networks