Download
1 / 10
100 likes | 220 Views
SEE Validation of SEU Mitigation Methods for FPGAs. Carl Carmichael 1 , Sana Rezgui 1 , Gary Swift 2 , Jeff George 3 , & Larry Edmonds 2 1 Xilinx Corporation, San Jose CA 2 Jet Propulsion Laboratory, Pasadena CA 3 Aerospace Corporation, Albuquerque NM.

E N D
SEE Validation of SEU Mitigation Methods for FPGAs Carl Carmichael1 , Sana Rezgui1, Gary Swift2, Jeff George3, & Larry Edmonds2 1Xilinx Corporation, San Jose CA2Jet Propulsion Laboratory, Pasadena CA3Aerospace Corporation, Albuquerque NM "This work was carried out in part by the Jet Propulsion Laboratory, California Institute of Technology, under contract with the National Aeronautics and Space Administration." "Reference herein to any specific commercial product, process, or service by trade name, trademark, manufacturer, or otherwise, does not constitute or imply its endorsement by the United States Government or the Jet Propulsion Laboratory, California Institute of Technology." 1
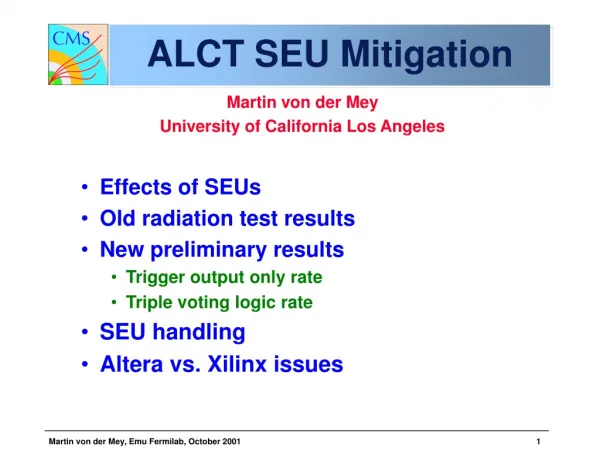
XTMR SEE Testing • Experiments were devised to focus TMR mitigation on major architectural elements of the Virtex-II FPGA. • Sequential State-Machines were created with Registers, Multipliers, and Memories • Configurable Logic Block • Combinatorial Logic, Sequential Logic, Arithmetics, Multiplexing. • Design implementation is an array of counters. • Multipliers • Dedicated 18 x 18 bit multiply function blocks. • Design implementation is array of Multiply and Accumulate functions. • Block Memories • Synchronous Dual Port 18k bit RAM blocks. • First Design is large memory block rewritten externally. • Second design Design implemented as an array of ROMs initialized to incrementing values with internal EDAC. 2
Plot Definitions • Predicted SEFI cross-section • Static and Dynamic SEE Characterization of the Virtex-II FPGA revealed several Single Event Functional Interrupt Modes: POR (2.5E-06), SMAP (1.72E-06), IOB (4.2E-06) • These combined cross-sections represent the minimum functional error cross-section for a single Virtex-II (XQR2V6000) device on orbit. • Worst Case Orbital Upset Rate • CREME96 calculation of the worst case orbital upset rate for a XQR2V6000 is 7,740 bit-errors/day (9E-02 bit-errors/sec) in a GEO orbit at 36,000km during the worst day of an Anomalously Large Solar Flare accounting for both Heavy Ion and Proton. In a 40MeV Kr beam the exact same upset rate is achieved with a Flux of 1.25E-01 p/cm2/s. This denotes that the equivalent upset rates for all other orbits and solar conditions would reside to the LEFT of this line. • Single Event Functional Interrupts • This is the average cross-section of the observed SEFI(s) while collecting the data represented in the plot. This cross-section is not Flux dependent. Variations from the predicted value are due to statistical significance of the total accumulated fluence during each test. • Functional Errors • Data plot of the observed events when the Device Under Test returned an incorrect result. Cross-section is determined by the number of error events divided by total fluence at the specified flux. TMR denotes that the DUT design was fully mitigated with XTMR and scrubbing. The Unmitigated results were obtained with an identically functional design without XTMR, however scrubbing was also used for the unmitigated test. • Extrapolation • A derived function describing the relation between Mitigation failure as a function of upset rate. Extension of the function predicts functional error cross-sections at worst case orbital upset rates to be less than SEFI cross-sections. 3
PLOT 1 3.5E-02 3.5E-01 3.5E+00 3.5E+01 3.5E+02 3.5E+03 Configuration Bit Errors per Scrub Cycle 36,000km GEO Orbit Worst Day Solar Flare 8,000 bit-errors/day All other orbits 40 MeV Kr LET= 22.3 MeV/cm2/mg SEFIs drive error rate for all designs and all orbits. Mitigation errors on orbit are always less than SEFI errors by orders of magnitude 4
PLOT 2 3.5E-02 3.5E-01 3.5E+00 3.5E+01 3.5E+02 3.5E+03 3.5E+03 Configuration Bit Errors per Scrub Cycle 36,000km GEO Orbit Worst Day Solar Flare 8,000 bit-errors/day All other orbits 40 MeV Kr LET= 22.3 MeV/cm2/mg SEFIs drive error rate for all designs and all orbits. Mitigation errors on orbit are always less than SEFI errors by orders of magnitude 5
PLOT 3 3.5E-02 3.5E-01 3.5E+00 3.5E+01 3.5E+02 3.5E+03 3.5E+03 Configuration Bit Errors per Scrub Cycle 36,000km GEO Orbit Worst Day Solar Flare 8,000 bit-errors/day All other orbits SEFIs drive error rate for all designs and all orbits. 40 MeV Kr LET= 22.3 MeV/cm2/mg Mitigation errors on orbit are always less than SEFI errors by orders of magnitude 6
Improved SEE Test Methodology for Mitigation • There is an expected physical relationship between functional error rate of a mitigated system as a function of upset rate. The expected relationship is a function that predicts the increasing probability of upsetting bit combinations that will cause a mitigated (TMR) system to fail as a function of bit upset rate: • R = Mitigation Error Rate • M = Number of groups of relevant bits • NB = Average number of relevant bits per group • TC = Scrub Time • r = Upset Rate of relevant bits. • Therefore, testing at extremely high fluxes over several orders of magnitude variation can be performed to reveal this functional relationship between mitigation error rate and bit upset rate. • This function can then be extrapolated to make predictions at the much lower upset rates of earth orbits. 7
N1 bits N2 bits N2 bits N1 bits N2 bits N1 bits . . . . . . . . . . . . . . . . . . Block (1,1) Block (2,3) Block (2,1) Block (2,2) Block (1,3) Block (1,2) Mitigation System Topology Module 1 Module 2 Module 3 Group 1 Group 2 … … … … Group M NM bits NM bits NM bits . . . . . . . . . Block (M,1) Block (M,2) Block (M,3) 8
Probability Function Fit for Counter Data M=9224 Ni=200 (same number of bits in each block) Sigma per bit =2.1E-8 cm2 TC=0.266 sec 9
Conclusions • Efficiency and accuracy of the validation of mitigation techniques is greatly improved by demonstrating the upset rate dependency of the mitigation method by testing at Flux rates that overwhelm the mitigation. • The static SEFI cross-section is the dominating factor for calculating orbital error rates for any Virtex-II design when mitigated with Full XTMR & Scrubbing. • Additional Work • Self-Scrubbing BlockRAMs • Self Scrubbing FPGA Configuration • Soft-core processors (e.g. Microblaze) 10