Download

1 / 26
280 likes | 524 Views
Connecting Urban Sprawl and Urban Heat Island. Matthew Welshans – GEOG 596A – Fall I 2013 Advisor: Dr. Jay Parrish. Project Summary. Define Urban Heat Island (UHI) and Urban Sprawl Outline Prior Research Highlight Planned Methodology for Project State Anticipated Results

E N D
Connecting Urban Sprawl and Urban Heat Island Matthew Welshans – GEOG 596A – Fall I 2013 Advisor: Dr. Jay Parrish
Project Summary Define Urban Heat Island (UHI) and Urban Sprawl Outline Prior Research Highlight Planned Methodology for Project State Anticipated Results Show Project Timeline
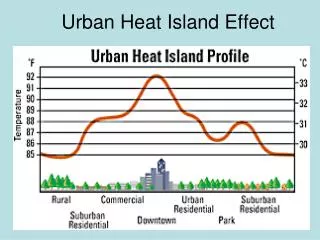
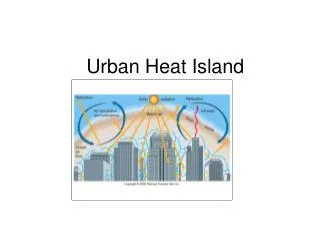
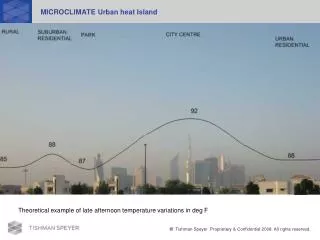
What is the Urban Heat Island? Image Source: US EPA (2012)
Why is Urban Heat Island a Concern? Kai Hendry (Flickr) Dr. Edwin Ewing/CDC Carrie Sloan (Flickr)
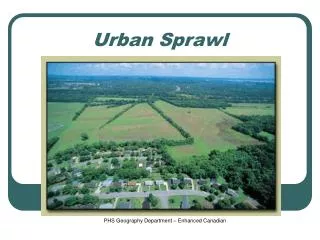
Urban Sprawl Example – Houston Area From 1990, 2000, and 2010 US Census SF1 Databases
Connecting Urban Heat Island to Urban Sprawl 1990 – 450km2 2000 – 620km2 From Streutker (2002)
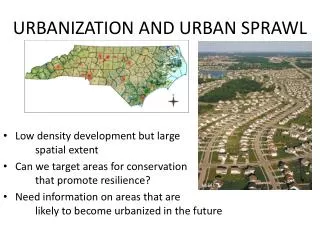
The Problem Urban Heat Island is affected by the growth of metropolitan areas • Size of heat island • Increase in temperature difference between rural/urban areas What is the correlation between increased urban sprawl and the change in urban heat island? How can it be measured objectively?
Previous Research Studies from several metropolitan areas • Atlanta, Houston, New York City, Toronto, Hong Kong, just to name a few! Differing satellite data sources • AVHRR • Landsat 5 TM /Landsat 7 ETM+ • ASTER Similar results: • As infrastructure increases, size and strength of UHI increases
Study Areas • Dallas-Ft. Worth-Arlington, TX MSA • 12 counties in northeast Texas • Humid Sub-Tropical Climate • 2010 Population: 6,426,214 • Minneapolis-St. Paul, MN/WI MSA • 11 counties in southeast Minnesota and 2 in western Wisconsin • Humid Continental Climate • 2010 Population: 3,317,308
Proposed Methodology Comparing 2000 to 2010 data • Census data for population and density in those study areas • Land use/land cover changes from those periods • Satellite imagery to measure skin (surface temperature)
Proposed Methodology Population Data • US Census defines urban areas as those having a population density of 1000 per sq mile and surrounding blocks of at least 500 per sq mile. • How has buildup changed over time?
Dallas-Ft. Worth-Arlington Urban Sprawl 2000 1990 2010
Minneapolis-St. Paul, MN/WI Urban Sprawl 2000 1990 2010
Proposed Methodology Land use/land cover • Unsupervised classification • Urban infrastructure • Green cover (trees/grass/etc) • Water • How much green cover has disappeared over time?
Temperature Data NWS Cooperative Network Potentially long climate record (100+ years) Standard data available Generally no urban obs Missing data at many stations From NWS Minneapolis-St. Paul Office
Temperature Data Satellite Data Coverage Area Measures Surface Temp Requires Cloud Free Days Relatively short climatology (~30 years for Landsat) Some potential error due to atmospheric effects
Comparing Satellite Sources From ASTER User Handbook Version 2 (2002)
Proposed Methodology Satellite Data • Separate Urban/Rural Land Cover Pixels and calculate mean temperature in each to determine strength of UHI (Jin, 2012). UHI = – • Temperature calculated using Gillepsie et al (1998)’s Temperature Emissivity Separation (TES) Method for each image. • Temperature can be determined from radiance reflected, but only if the surface emissivity is known.
Proposed Methodology ASTER TES Method (Gillepsie et al, 1998) • ASTER Image: • Reflected Radiance • Sky Irradiance • STEP 2 • Calculate spectrum of ratios of to average • STEP 4 • Flag any failures • Estimate accuracy and precisions • STEP 1 • Filter out sky irradiance • Estimate • Estimate T • STEP 3 • Calculate max-min diff in each band • Predict • Recalculate T • Final Image • Temperature (+/-1.5K) • Emissivity for five bands
Correlating UHI and Urban Sprawl Overlay Analysis – Temperature patterns (isotherms) compared to land use and/or pop density maps • Measure size changes • Compare to land use change over time Sample point data for different land use types • Correlate changes in temperature between two time frames • Plot regression lines to determine relationships
Anticipated Results Expecting to find strong correlation between urban sprawl patterns and urban heat island patterns (Overlay Analysis) Statistical analysis should show that temperature increases are somewhat dependent on the land cover over an area.
Sources Abrams, M., Hook, S. & Ramachandran, B. (2002). ASTER User Handbook (Version 2). Pasadena, CA: NASA Jet Propulsion Laboratory. Obtained from http://asterweb.jpl.nasa.gov/content/03_data/04_Documents/aster_user_guide_v2.pdf Jin, M. (2012). Developing an Index to Measure Urban Heat Island Effect Using Satellite Land Skin Temperature and Land Cover Observations. Journal of Climate, 25, 6193-6201. doi:http://doi.org/10.1175/JCLI-D-11-00509.1 Land Processes Distributed Active Archive Center (2013). ATSER SWIR User Advisory. Retrieved from https://lpdaac.usgs.gov/sites/default/files/public/aster/docs/ASTER_SWIR_User_Advisory_July%2018_08.pdf Mallick, J., Rahman, A., & Singh, C.K. (2013). Modeling urban heat islands in heterogeneous land surface and its correlation with impervious surface area by using night-time ASTER satellite data in highly urbanizing city, Delhi-India. Advances in Space Research, 52, 639-655. doi:http://dx.doi.org/10.1016/j.asr.2013.04.025 Nichol, J., Fung, W.Y., Wong, M.S. (2009). Urban heat island diagnosis using ASTER satellite images and ‘in situ’ air temperature. Atmospheric Research, 94, 276-284. doi:http://dx.doi.org/10.1016/j.atmosres.2009.06.011
Sources Office of Management and Budget (2009). OMB Bulletin Number 10-02: “Update of Statistical Area Definitions and Guidance on Their Uses.” Retrieved from http://www.whitehouse.gov/sites/default/files/omb/assets/bulletins/b10-02.pdf Rajasekar, U. & Weng, Q. (2009). Spatio-temporal modeling and analysis of urban heat islands by using Landsat TM and ETM+ imagery. International Journal of Remote Sensing, 30(13), 3531-3548. doi:http://dx.doi.org/10.1080/01431160802562289 Rinner, C. & Hussain, M. (2011). Toronto’s Urban Heat Island—Exploring the Relationship between Land Use and Surface Temperature. Remote Sensing, 3, 1251-1265. doi:http://dx.doi.org/10.3390/rs3061251 Streutker, D. (2003). Satellite-measured growth of the urban heat island of Houston, Texas. Remote Sensing of Environment, 85, 282-289. doi:http://dx.doi.org/10.1016/S0034-4257(03)00007-5 United States Environmental Protection Agency (2012). “Heat Island Effect.” Retrieved from http://www.epa.gov/heatisld/about/index.htm