Download
1 / 26
260 likes | 269 Views
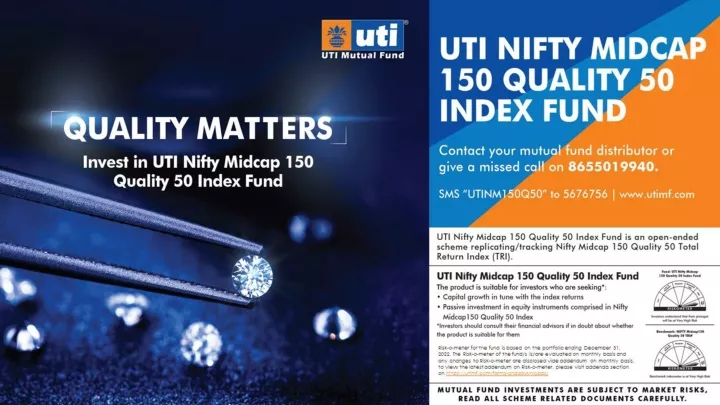
tThe UTI Nifty Midcap 150 Quality 50 Index Fund measures the performance of 150 mid cap market capitalisation companies. Click here to know more!<br>

E N D
Investing in high quality Midcap companies which are generally consistent*and resilient@ *In terms of stability of earnings 2 @In terms of sustainability during adverse economic events
What are Mid-caps Large Cap – Market Cap Segment Cumulative Market Cap (In ₹Trillion) Number of Companies Market Cap Range ₹48,899 Cr and Above 100 191.32 Mid Cap – Market Cap Segment Cumulative Market Cap (In ₹Trillion) Number of Companies Market Cap Range ₹16,814 Cr to ₹48,686 Cr 150 44.03 Small Cap – Market Cap Segment Cumulative Market Cap (In ₹Trillion) Number of Companies Market Cap Range Below ₹16,474 Cr 1406^ 38.77 Source: Classification as per SEBI circular (SEBI / HO/ IMD/ DF3/ CIR/ P/ 2017/ 114) dated October 6, 2017, wherein the universe of “Mid Cap” shall consist of 101st to 250th company in terms of full market capitalization. *AMFI - As on December 31, 2022. ^Stock cut off – Market Cap above Rs 250 Cr 3
Why Midcap : High Return Potential with higher Volatility compared to Large Cap 18000 16000 16.7% 14000 12000 14.8% 10000 8000 6000 4000 2000 0 Large Cap Midcap Large Cap – NIFTY 100 TRI | Mid Cap – NIFTY Midcap 150 TRI Data as on December 31, 2022. Inception i.e., base date of Nifty Midcap 150 Index TRI is April 1, 2005. TRI i.e. ‘Total Return Index’ consider reinvestment of dividends issued by companies forming part of Index. www.niftyindices.com, Data points rebase to 1000. The Indices referred in this literature are not an endorsement by the Mutual Fund and AMC of their soundness or a recommendation to buy or sell at any point of time. These are only for reference purpose. Graph is to represent overall movement of indices and not specific to particular time period. Past performance does not guarantee future performance of the scheme 4
Why Midcap : High Return Potential with higher Volatility compared to Large Cap 3 Years 5 Years 10 Years Large Cap 12.0% Large Cap 12.3% Large Cap 12.2% Mid Cap 14% Mid Cap 14.5% Mid Cap 14.9% Large Cap 6.9% Large Cap 4.8% Large Cap 2.6% Mid Cap 11.1% Mid Cap 6.7% Mid Cap 3.4% Number of Observations : 3,656 Number of Observations : 3,170 Number of Observations : 1,923 % of Outperformance of Midcap Vs Largecap: 59% % of Outperformance of Midcap Vs Largecap: 70% % of Outperformance of Midcap Vs Largecap: 97% Volatility Return Large Cap – NIFTY 100 TRI | Mid Cap – NIFTY Midcap 150 TRI Source : MFI . Returns based on Average Returns calculated on daily rolling for respective Period . Volatility based on standard deviation calculated on daily rolling returns for respective Period. Data since inception date of NIFTY Midcap 150 TRI i. e April 01, 2005. Past performance may or may not be sustained in the future and shall not be used for comparison with other investments. The figures pertain to performance of the index and do not indicate the returns/performance of the scheme. It is not possible to invest directly in Index. Data as on December 31, 2022. 5
Why Quality selection within Midcap Universe 6
Quality, Growth and Valuations for selection Within Midcap Quality Growth Valuation ROE % 5 Year CAGR P/E Ratio 30.0% 26.0% 32 30.15 30 20.0% 26.79 28 13.2% 14.52% 26 10.0% Sales 24 11.14% P/E - 1 Yr Trailing 0.0% Midcap Quality Midcap 150 Midcap Quality Midcap 150 Debt to Equity Times Dividend Yield 300.00 2.0 19.47% 1.7 PAT 200.66 1.5 1.2 200.00 -3.21% 1.0 100.00 0.5 23.66 -5% 0% 5% 10% 15% 20% 25% 0.0 0.00 Midcap Quality Midcap 150 Midcap Quality Midcap 150 Midcap Quality Midcap 150 @Product of NSE Indices Limited (a subsidiary of National Stock Exchange of India (NSE) Limited). # Source: Bloomberg, ACE Equity, NSE Indices Ltd. Data as on December 31, 2022, for FY 23 7
Investment Journey : Quality Selection within Midcap NIFTY Midcap 150 Quality 50 TRI Nifty Midcap 150 TRI Period Nifty Mid Cap 150 Quality 50 Parameter Nifty Mid Cap 150 FY06 76% 75% CAGR Returns % 18.7% 16.4% FY07 0% -1% 30000 Value of ₹1 Lac Invested 22.0 lacs 14.6 lacs FY08 11% 21% FY09 -35% -49% 25000 FY10 145% 136% FY11 20% 5% 20000 FY12 0% -5% FY13 2% 4% 15000 FY14 30% 18% FY15 63% 60% 10000 FY16 -4% -2% FY17 36% 37% 5000 FY18 24% 17% FY19 0% -1% 0 FY20 -21% -30% Jul-11 Jul-06 Jul-16 Jul-21 Apr-05 Apr-10 Apr-15 Apr-20 Oct-12 Oct-07 Oct-17 Oct-22 Jan-09 Jan-14 Jan-19 FY21 78% 102% FY 22 19% 25% NIFTY Midcap 150 Quality 50 Nifty Midcap 150 TRI FYTD* -3% 7% NIFTY Midcap 150 Quality has outperformed NIFTY Midcap 150 since inception and 11 times out of last 18 FYs Source : MFI, NIFTY Indices Ltd as on December 31, 2022, based on Total Returns Index. Past performance may or may not be sustained in the future and shall not be used for comparison with other investments. The figures pertain to performance of the index and do not indicate the returns/performance of the scheme. It is not possible to invest directly in Index. FYTD – April 01, 2005 to December 31, 2022. 8
Periodic Returns : Quality factor offers protection during rough patches 140% 122.5% 112.6% 120% 100% 80.8% 69.2% 80% 64.3% 60.4% 60% 31.3% 20.3% 40% 26.3% 5.2% 19.8% 20% 4.6% 2.4% 1.9% 0% -0.6% -3.2% -20% -7.0% -11.6% -17.0% -25.6% -40% -35.1% -38.5% -43.7% -60% -57.7% -80% E1 E2 E3 E4 E5 E6 E7 E8 E9 E10 E11 E12 NIFTY Midcap 150 Quality 50 Nifty Midcap 150 TRI E1 Economic Recovery 01/04/2005 07/03/2008 E7 Global Growth Stabilisation 31/03/2015 31/01/2018 E2 Global Financial Crisis 07/03/2008 09/03/2009 E8 LTCG on Equities 31/01/2018 28/03/2018 E3 Post Crisis Recovery 09/03/2009 09/11/2010 E9 Demonestisation and GST implementation 28/03/2018 07/02/2020 E4 Eurozone Debt Crisis 09/11/2010 30/01/2012 E10 Covid-19 Pandemic 07/02/2020 23/03/2020 E5 Policy Paralysis 30/01/2012 31/08/2013 E11 Post Covid Recovery 23/03/2020 17/01/2022 E6 Oil Price Correction 30/08/2013 31/03/2015 E12 Geo-Political Tension 17/01/2022 31/12/2022 Source : NIFTY Indices Ltd as on December 31, 2022, based on Total Returns Index. Index Inception Date is 01 April 2005. Past performance does not guarantee future performance of the scheme. Past performance may or may not be sustained in the future and shall not be used for comparison with other investments. The figures pertain to performance of the index and do not indicate the returns/performance of the scheme. It is not possible to invest directly in Index 9
Presenting UTI Nifty Midcap 150 Quality 50 Index Fund (An open-ended scheme replicating/tracking NIFTY Midcap150 Quality 50 Total Return Index(TRI) 10
About ‘Nifty Midcap150 Quality 50’ Index@ (The Index) Universe Selection Weights Rebalancing Top 50 stocks on ‘Quality” Score - Return on Equity - Financial Leverage - EPS growth variability Based on the combination of stock’s quality score and its free float market capitalization Components of Nifty 150 Midcap Index Semi-annual The Nifty Midcap150 Quality 50 index includes top 50 companies from its parent Nifty Midcap 150 index, selected based on their ‘quality’ scores. The quality score for each company is determined based on return on equity, financial leverage (except for financial services companies) and earning per share (EPS) growth variability of each stock analysed during the previous 5 financial years. The weight of each stock in the index is based on a combination of stock’s quality score and its free float market capitalization. @Product of NSE Indices Limited (a subsidiary of National Stock Exchange of India (NSE) Limited). Quality score is calculated on the basis of return on equity (ROE), debt-to-equity (D/E) ratio and EPS growth variability in the previous 5 years. Debt-toequity ratio is not considered for companies belonging to financial services sector. 11
Nifty Midcap150 Quality 50 Index@– The Universe Market Cap Filter Quality Filters The Index NIFTY Midcap 150 Quality 50 Index Universe (50 Stocks) NIFTY 500 Universe (500 Stocks) NIFTY Midcap Index Universe (150 Stocks) @Product of NSE Indices Limited (a subsidiary of National Stock Exchange of India (NSE) Limited). Source: Index Methodology Document. Above details are for simple understanding and are subject to other criteria mentioned in methodology document. 12
Nifty Midcap150 Quality 50’ Index@– Quality Filters Assessment of Financial Health of the Company with : Return on Equity Financial Analysis Debt to Equity Ratio Balance Sheet Analysis EPS Growth Variability Profit & Loss Analysis ROE is an indicator of a company's profitability and how efficiently it generates those profits utilizing its capital. Indicates financial strength of the company Measures earning Quality of a company. Higher-leverage ratios tend to indicate potentially higher financial risk. Consistency of EPS growth reflects healthy earning quality. Not considered for financial services companies Stocks with negative EPS in any of the previous 6 fiscal years are not considered for selection @Product of NSE Indices Limited (a subsidiary of National Stock Exchange of India (NSE) Limited). Source: Index Methodology Document. Above details are for simple understanding and are subject to other criteria mentioned in methodology document. 13
Nifty Midcap150 Quality 50’ Index@– Weightages & Rebalancing Weight of the Stock Weight Capping Rebalancing Weight of the stock in the index Weight of each stock in the index is capped at Index reconstitution will be done on a semi-annual basis in June and December = Quality score * Square root of free float market cap of that stock the lower of 5% 5 times the weight of the stock in the index based only on free float market capitalization @Product of NSE Indices Limited (a subsidiary of National Stock Exchange of India (NSE) Limited). Source: Index Methodology Document. Above details are for simple understanding and are subject to other criteria mentioned in methodology document. 14
NIFTY Midcap 150 Quality 50 Index – Top 10 Holding KEY TAKEAWAYS Stock Name Sector Weightage (%) NIFTY Midcap 150 Quality 50 Index offers a diversified exposure at stock level. 4.89 Page Industries Ltd. Textiles 3.80 Tata Elxsi Ltd. IT 3.79 Indian Energy Exchange Ltd. Financial Services 3.47 Tube Investments Of India Ltd. Auto & Auto Components Maximum weight assigned to each stock is lower of – 5% or 5 times the weight of stock in NIFTY Midcap 150 Index 2.84 ICICI Securities Ltd Financial Services 2.79 APL Apollo Tubes Ltd. Capital Goods 2.61 Persistent Systems Ltd. IT 2.57 Petronet LNG Ltd. Oil, Gas & Consumable Fuels 2.52 AU Small Finance Bank Ltd Financial Services 2.51 Astral Ltd. Capital Goods 31.80 Total Source : NSE Indices Ltd as on December 31, 2022. The sector(s)/stock(s)/issuer(s) mentioned above do not constitute any research report/recommendation and the schemes may or may not have any future position in these sector(s)/stock(s)/issuer(s)”. 16
NIFTY Midcap 150 Quality 50 Vs NIFTY Midcap 150 – Active Sector Exposure KEY TAKEAWAYS NIFTY Midcap150 Quality 50 Index 5.8% 14.63% 14.43% 9.53% 1.16% 2.21% 11.91% 12.52% 12.46% 1.27% 2.04% 5.81% 6.22% NIFTY Midcap 150 Index 8.44% 12.32% 6.82% 5.66% 0.35% 4.32% 20.46% 10.46% 4.72% 1.47% 2.76% 2.76% 1.94% 1.73% 3.20% 2.19% 1.45% 1.91% 5.95% Sectors Active Weight* NIFTY Midcap 150 Quality 50 has higher exposure than NIFTY Midcap 150 to sectors with higher ROE and lower earning variability like IT, Consumer Goods, Chemicals etc. Automobile and Auto Components Capital Goods Chemicals Consumer Durables Diversified Fast Moving Consumer Goods Financial Services Healthcare Information Technology Media, Entertainment & Publication Metals & Mining Oil, Gas & Consumable Fuels Textiles Power Realty Services Telecommunication Construction Materials Consumer Services -2.64% 2.31% 7.61% 3.87% 0.81% -2.11% -8.55% 2.06% 7.75% -0.20% -0.72% 1.95% 4.29% -1.73% -3.20% -2.19% -1.45% -1.91% -5.95% NIFTY Midcap 150 Quality 50 has no exposure to sectors with higher Debt to Equity ratio like realty, construction, power, telecom etc. Source : NIFTY Indices Ltd as on December 31, 2022. * Active Weight = NIFTY Midcap 150 Quality 50 Index – NIFTY Midcap 150 Index weight of the particular sector. Top 5 overweight is highlighted in green and Top 5 underweight is highlighted in red. The sector(s)/stock(s)/issuer(s) mentioned above do not constitute any research report/recommendation and the schemes may or may not have any future position in these sector(s)/stock(s)/issuer(s)”. 17
Nifty Midcap 150 Quality 50 Index Comparison – Current Performance RETURNS % STANDARD DEVIATION (%) RISK ADJUSTED RETURNS PERIOD NIFTY NIFTY NIFTY Nifty Nifty Nifty Midcap 150 Quality 50 TRI Midcap 150 Quality 50 TRI Midcap 150 Quality 50 TRI Midcap 150 TRI NIFTY 50 TRI Midcap 150 TRI NIFTY 50 TRI Midcap 150 TRI NIFTY 50 TRI 1 Year -9.0% 3.9% 5.7% 16.5% 19.1% 17.2% -0.54 0.21 0.03 0.87 3 Years 16.9% 24.6% 15.5% 19.5% 21.6% 22.4% 1.14 0.69 11.2% 5 Years 8.9% 12.8% 17.3% 19.4% 19.3% 0.51 0.57 0.66 7 Years 14.7% 16.0% 13.9% 16.1% 18.3% 17.6% 0.91 0.87 0.79 10 Years 17.7% 17.4% 13.2% 15.4% 17.7% 17.1% 1.15 0.98 0.77 Since Inception 18.7% 16.4% 14.4% 18.2% 21.5% 21.9% 1.03 0.76 0.66 NIFTY Midcap 150 Quality 50 TRI delivered better Risk-Adjusted Returns the NIFTY Midcap 150 TRI over medium to long term investment horizon. Data From April 1, 2005 to December 31, 2022. TRI i.e., 'Total Return Index’ consider reinvestment of dividends issued by companies forming part of Index. Source: MFI Explorer & NIFTY Indices Limited. Returns are CAGR. Standard Deviation is based on the daily returns for the respective period. Since Inception – April 01, 2005 – June 30, 2022. Past performance may or may not be sustained in the future and shall not be used for comparison with other investments. The figures pertain to performance of the index and do not indicate the returns/performance of the scheme. It is not possible to invest directly in Index 19
Nifty Midcap 150 Quality 50 Index Comparison – Monthly Return Distribution Nifty Midcap 150 Quality 50 TRI Parameters Nifty Midcap 150 TRI Nifty 50 TRI Nifty Midcap 150 Quality 50 has captured 88% of Nifty Midcap 150 up moves, whereas it has lost less than Nifty Midcap 150, 75% during the periods when Nifty Midcap 150 has declined, thus offers downside protection. 213 213 213 Number of months 62% 64% 62% Months delivering +ve returns Average Return - when Nifty Midcap 150 TRI delivered +ve returns Average Return - when Nifty 50 TRI delivered +ve returns 5.09% 5.81% -- Similarly, Nifty Midcap 150 Quality 50 has captured 97% of Nifty 50 up moves, whereas it has lost less than Nifty 50, 76% during the periods when Nifty 50 has declined. 4.87% -- 5.00% -- 88% 97% Up-capture vs respective index Average Return in months when Nifty Midcap 150 TRI delivered -ve returns Average Return in months when Nifty 50 TRI delivered -ve returns This shows that the Quality filters Investing strategy within the Midcap space is working well against both the indices. -4.43% -5.92% -- -3.38% -- -4.42% -- 75% 76% Down-capture vs respective index 100% Absolute Returns 50% 0% -50% -100% NIFTY Midcap 150 Quality 50 Nifty Midcap 150 TRI Data From April 1, 2005 to December 31, 2022. TRI i.e., 'Total Return Index’ consider reinvestment of dividends issued by companies forming part of Index. Source: MFI Explorer & Nifty Indices Limited. Up-capture = average return when respective index is +ve / average return of Nifty Midcap 150 Quality 50 TRI at that time. Past performance may or may not be sustained in the future and shall not be used for comparison with other investments. The figures pertain to performance of the index and do not indicate the returns/performance of the scheme. It is not possible to invest directly in Index 20
Rolling return analysis 3 Years Rolling Returns 5 Years Rolling Returns Min Max Avg Min Max Avg 35% 60% 33.0% 49.8% 29.1% 30% 50% 39.6% 40% 25% 30% 20% 19.0% 20% 18.1% 15% 14.5% 13.8% 10% 10% 0% 5% 2.6% -10% 0% -20% -12.3% -17.2% -5% -30% -2.3% Nifty Midcap 150 Quality 50 TRI Nifty Midcap 150 TRI Nifty Midcap 150 Quality 50 TRI Nifty Midcap 150 TRI No. of Observation 3,653 3,653 3,166 3,166 Standard Deviation 10.1% 11.1% 5.7% 6.7% Instances of +ve Returns 95% 89% 100% 99% 84% 71% 99% 82% Over 8% Source: MFI Explorer. Rolling Returns with daily frequency of indices as mentioned above on 3 and 5 years periods respectively. CAGR – Compounded Annual Growth Rate. Data period: April 10, 2005 to December 31, 2022. Past performance may or may not be sustained in future. Past performance may or may not be sustained in the future and shall not be used for comparison with other investments. The figures pertain to performance of the index and do not indicate the returns/performance of the scheme. It is not possible to invest directly in Index 21
About UTI NIFTY Midcap 150 Quality 50 Index Fund Investment Objective Investment Universe Investment Strategy Performance The investment objective of the scheme is to provide returns that, before expenses, closely correspond to the total returns of the securities as represented by the underlying index, subject to tracking error. However, there is no guarantee or assurance that the investment objective of the scheme will be achieved. The investment universe of the fund will be the constituents of NIFTY Midcap 150 Quality 50 Index. The scheme is a low-cost smart beta index Fund which tracks the NIFTY Midcap 150 Quality 50 Index passively. The scheme will endeavor to achieve return equivalent to returns of the underlying index while minimizing tracking error. The scheme will endeavor to replicate the performance of NIFTY Midcap 150 Quality 50 Index 22
Key Stats : UTI NIFTY Midcap 150 Quality 50 Index Fund Type of scheme Market Cap Exposure* Large Cap – NIL Mid Cap – 100% Small Cap - Nil An Open-ended scheme replicating/tracking NIFTY Midcap 150 Quality 50 Index TRI Entry and Exit Load* NIL Plans & Options Minimum Application Amount Minimum initial investment is ₹5,000/- and in multiples of ₹1/- thereafter. Subsequent minimum investment under a folio is ₹1,000/- and in multiples of ₹1/- thereafter with no upper limit. Regular Plan and Direct Plan – Both Plan offers Growth Option Only * As on December 31, 2022 23
Why UTI Index Funds 01 Experience Experience of managing Index Funds over 2 decades 02 Largest Asset Manager in the Equity Index Fund Category Scale Managing one of the lower Tracking Error across Time Frames 03 Track Record 04 Adequate Systems & Processes for efficient replication strategy System & Processes Maintaining Competitive Expense Structure across Index Fund offerings 05 Cost Structure $ Source : MFI as on December 31, 2022 24
Why UTI NIFTY Midcap 150 Quality 50 Index Fund ? Diversified Portfolio of relatively Quality Businesses within the midcap segment The Fund shall follow a passive strategy by investing into the constituents of NIFTY Midcap 150 Quality 50 Index , where the index construction is based on the “Quality Filters” within the midcap universe as : Suitable for: Investors looking to take exposure in the midcap segment while investing in relatively quality businesses that may generate economic value Investors looking for a passive fund which brings disciplined approach to the portfolio construction, while adhering to the defined quality selection process “Quality” companies generally rebound faster based on the strong fundamentals of balance sheets & business models “Quality” companies generally performs across market cycles “Quality” companies generally mitigate drawdown Focused and Disciplined Long Term Wealth Creation A diversified portfolio of high quality businesses that are expected to deliver long term growth By investing only into companies that generate economic value the fund may generate superior wealth for investors in the medium to long run Based on Index construct as on December 31, 2022 25
REGISTERED OFFICE: UTI Tower, ‘GN’ Block, Bandra Kurla Complex, Bandra (E), Mumbai - 400051.Phone: 022 – 66786666. UTI Asset Management Company Ltd (Investment Manager for UTI Mutual Fund) Email: invest@uti.co.in . (CIN-L65991MH2002PLC137867). For more information, please contact the nearest UTI Financial Centre or your AMFI/NISM certified UTI Mutual Fund- Mutual Fund Distributor (MFD)/Independent Financial Advisor (IFA) for a copy of the Statement of Additional Information, Scheme Information Document and Key Information Memorandum cum Application Form. Disclaimers: The information on this document is provided for information purposes only. It does not constitute any offer, recommendation or solicitation to any person to enter into any transaction or adopt any hedging, trading or investment strategy, nor does it constitute any prediction of likely future movements in rates or prices or any representation that any such future movements will not exceed those shown in any illustration. Users of this document should seek advice regarding the appropriateness of investing in any securities, financial instruments or investment strategies referred to on this document and should understand that statements regarding future prospects may not be realized. The recipient of this material is solely responsible for any action taken based on this material. Opinions, projections and estimates are subject to change without notice. UTI AMC Ltd is not an investment adviser, and is not purporting to provide you with investment, legal or tax advice. UTI AMC Ltd or UTI Mutual Fund (acting through UTI Trustee Company Pvt. Ltd) accepts no liability and will not be liable for any loss or damage arising directly or indirectly (including special, incidental or consequential loss or damage) from your use of this document, howsoever arising, and including any loss, damage or expense arising from, but not limited to, any defect, error, imperfection, fault, mistake or inaccuracy with this document, its contents or associated services, or due to any unavailability of the document or any part thereof or any contents or associated services. MUTUAL FUND INVESTMENTS ARE SUBJECT TO MARKET RISKS, READ ALL SCHEME RELATED DOCUMENTS CAREFULLY 26