Download
1 / 27
270 likes | 291 Views
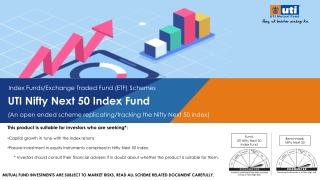
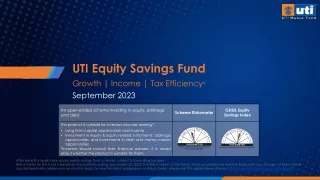
UTI Mastershare Unit Scheme is Indiau2019s first diversified equity- oriented fund. It mainly invests in large-cap companies. Invest in UTI Mastershare fund today!<br>

E N D
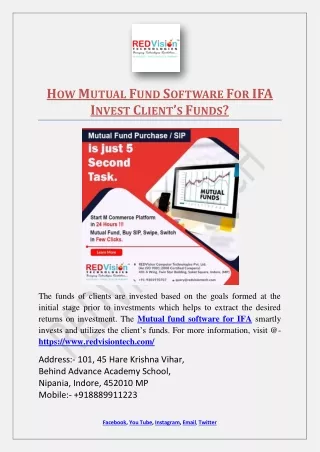
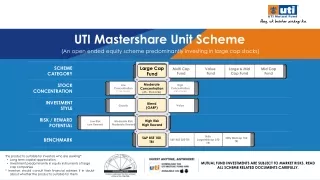
Information Classification: UTI AMC - Private UTI Mastershare Unit Scheme (An open ended equity scheme predominantly investing in large cap stocks) SCHEME CATEGORY Large Cap Fund Multi Cap Fund Value Fund Large & Mid Cap Fund Mid Cap Fund Moderate Concentration (45 - 55 stocks) STOCK Low High Concentration (> 55 stocks) Concentration (<45 stocks) CONCENTRATION INVESTMENT Blend (GARP) Value Growth STYLE RISK / REWARD POTENTIAL High Risk High Reward Low Risk Low Reward Moderate Risk Moderate Reward Nifty S&P BSE 100 TRI Nifty Midcap 150 TRI BENCHMARK S&P BSE 200 TRI LargeMidcap 250 TRI This product is suitable for investors who are seeking*: • Long term capital appreciation • Investment predominantly in equity instruments of large cap companies * Investors should consult their financial advisers if in doubt about whether the product is suitable for them MUTUAL FUND INVESTMENTS ARE SUBJECT TO MARKET RISKS, READ ALL SCHEME RELATED DOCUMENTS CAREFULLY. Information Classification: UTI AMC - Private
Information Classification: UTI AMC - Private TEAM Team driven approach Discussion & Review POWERED BY PROCESS Standardized research methodology Companies get Operating Cash Flow (OCF) & Return on Capital Employed (RoCE) ratings based on their previous 5 years financials 3 Tier Rating System RoCE Rating R2 R3 R1 OCF Rating C2 C3 C1 CONSISTENCY HIGH LOW CONSISTENCY HIGH LOW Identifying good stocks, avoiding poor stocks Consistency over time STRATEGIES Support diverse strategies Style discipline – mandate & style drive the choice of stocks across the OCF & RoCE tiers Operating Cash Flow (OCF) Tiers - 3 Tiers (C1/ C2/ C3) based on the number of years in which they have generated positive operating cash flows in the previous 5 years (for manufacturing companies). Return on Capital Employed (RoCE) / Implied Return on Equity (RoE) Tiers - 3 Tiers (R1/ R2/ R3) based on the previous 5-year average return on capital (for manufacturing companies & non-lending nonbanking finance companies (NBFCs)) & based on the previous 5-year average return on asset for banks & NBFCs (including housing finance companies). Information Classification: UTI AMC - Private MUTUAL FUND INVESTMENTS ARE SUBJECT TO MARKET RISKS, READ ALL SCHEME RELATED DOCUMENTS CAREFULLY
Information Classification: UTI AMC - Private Product Spectrum on Risk v/s Return Grid (Active Funds) CORE ALLOCATION CORE SATELLITE ALLOCATION TACTICAL ALLOCATION UTI B&FS Fund UTI Healthcare Fund UTI T&L Fund RETURN POTENTIAL UTI India Consumer Fund UTI Dividend Yield Fund UTI Focused Equity Fund UTI Infrastructure Fund UTI MNC Fund UTI Core Equity Fund UTI Flexi Cap Fund UTI Mid Cap Fund UTI Small Cap Fund UTI LTEF (Tax Saving) UTI Mastershare Unit Scheme UTI Value Opportunities Fund RISK / STANDARD DEVIATION UTI LTEF (Tax Saving) – UTI Long Term Equity Fund (Tax Saving); UTI B&FS Fund – UTI Banking & Financial Services Fund; UTI T&L Fund – UTI Transportation & Logistics Fund Information Classification: UTI AMC - Private The above representation is only for understanding purpose, one should not constitute portfolio only based on the above and advised to approach their financial advisors based on the investors respective risk profile before making investment decisions. 3
Information Classification: UTI AMC - Private UTI Mastershare Unit Scheme: Advantage Large Cap Leadership Such companies enjoy market dominance by extending quality offerings in their industries Financial Strength Large cap companies have strong Balance Sheets and thus have the appetite to support their brands 01 02 Resilient Business Model Smooth Sail Through Business Cycles Competitive Edge Economies of Scale These companies offer cost advantage due to large scale and efficient processes Large cap companies can offer competitive pricing in their industries due to low cost resources and better technology 04 03 Information Classification: UTI AMC - Private 4
Information Classification: UTI AMC - Private Examples of Market Leaders (Top 5 Stocks in the Portfolio) A financial conglomerate and India's largest housing finance company by assets India's second largest IT services company, with a large global presence A leading global telecommunications company Second largest bank in India by market capitalization Business Profile Third-largest private- sector bank in India Strong retail liability franchise, growing retail focus in advances Leadership in non lending financial services through subsidiaries Strong capabilities, Diversified client base. PAT expansion of 83 times to Rs. 22106 crs in 21 years (as of March 2021) It operates in 18 countries across South Asia and Africa. One of India’s largest mobile network operators Key Successful track record of more than 2 decades of navigating various credit/ liquidity cycles Comprehensive exposure to various product suites, string deposit franchise Leadership Factors India's second largest IT services company, with a large global presence Infosys Ltd. Stock Bharti Airtel Ltd. Axis Bank Ltd. ICICI Bank Ltd. HDFC Ltd. Sector/ Industry Financial Services | Banks Financial Services | Finance IT | IT - Software Financial Services | Banks Telecom | Telecom Services ` 6,07,566 Crs | Large Cap ` 4,45,110 Crs | Large Cap ` 6,37,512 Crs | Large Cap ` 2,47,297 Crs | Large Cap ` 4,41,360 Crs | Large Cap Market Cap. Source: Bloomberg, Company Websites Data as of December 31, 2022. Market Cap. categorisation is as of December 31, 2022 as per SEBI’s definition of market capitalisation. Market Cap. – Market Capitalisation Information Classification: UTI AMC - Private 5 4
Information Classification: UTI AMC - Private Investment Strategy Growth at Reasonable Price (GARP) Competitive Franchise Given the underlying growth in earnings of Companies with competitive franchise a company, how much is the reasonable have benefits of pricing power or cost price that one should pay to buy that competitiveness for long period of time. stock in the portfolio. Tend to have strong fundamentals with Provides a framework to buy companies low debt, profitability focus, consistent having future earnings growth as well as cash-flow and higher ROCE. valuation comfort. Thrust for long term wealth creation by owning a portfolio of quality companies Information Classification: UTI AMC - Private 6
Information Classification: UTI AMC - Private Examples of Competitive Franchise (1) Financials – Premium Valuations v/s Sustainable Growth Retail Bank (1998 – 2021) Min Max Current Current & Savings Deposits 38.8% 60.6% 46.1% Liability Franchise NIM 3.0% 4.5% 4.1% ― Low-cost deposits Op Cost / Income 36.3% 51.7% 36.3% ― Better NIM ROA 1.4% 1.9% 1.8% Underwriting process discipline ― Low Stress/ Credit costs Retail Bank 1998 2021 CAGR ― Higher ROA/ ROE Advance (Rs. Crore) 842 12,59,099 37% Sustainable Growth Profit (Rs. Crore) 63 25,287 31% Source: Companies filings NIM – Net Interest Margin, NII – Net Interest Income, RoA – Return on Asset, RoE – Return on Equity, CAGR – Compounded Annualized Growth Rate The above is to illustrate the concept of identifying stocks in the market. There is also a possibility of the expected event not happening or some other unforeseen event that may affect performance of the company. The performance of stocks would ultimately depend on various factors such as prevailing market conditions, global political scenario, exchange rate etc. Investors are requested to note that there are various factors (both local and international) that can have impact on the future performance and expectations of any company. Information given is available in public domain. There is no assurance or guarantee of any company being able to sustain its performance in future. There is no assurance or guarantee that the scheme would invest in this stock. Information Classification: UTI AMC - Private 7
Information Classification: UTI AMC - Private Examples of Competitive Franchise (2) Financials – Improving Trajectory and Attractive Valuation Opportunity spotted in 2018 when Relative Position in 2018 Asset quality issues and rising credit costs for the sector Issues with management (realignment of CEO) Competitive Advantage of CASA and Capital Adequacy Key Parameters % Remarks Current & Savings Deposits Strong cost of Funds advantage of low 51.7% Op Cost / Income 44.7% In line with competition Depressed but no negative surprises to guidance asset quality Low but relatively better due to divestment of subsidiaries Ability to grow w/o capital constraint Valuation Valuation at 4.9x Price to pre provisioning profits, at a discount to competition ROA 0.8% on ROE 6.8% Tier I Capital 15.9% Competitive Advantages Sustained High proportion of CASA Av. 46% Strong capital adequacy 18% Price to Pre-Provision Profits 4.9x At a discount to peers CEO – Chief Executive Officer; CASA – Current Account Savings Account The above is to illustrate the concept of identifying stocks in the market. There is also a possibility of the expected event not happening or some other unforeseen event that may affect performance of the company. The performance of stocks would ultimately depend on various factors such as prevailing market conditions, global political scenario, exchange rate etc. Investors are requested to note that there are various factors (both local and international) that can have impact on the future performance and expectations of any company. Information given is available in public domain. There is no assurance or guarantee of any company being able to sustain its performance in future. There is no assurance or guarantee that the scheme would invest in this stock. Information Classification: UTI AMC - Private 8
Information Classification: UTI AMC - Private Examples of Competitive Franchise (3) Passenger Vehicles Manufacturer Larger after market reach Superior cash flow generation No major dent in Volume growth relative competition, despite delay in new model launch distribution and Profitability, working capital, cash flows and capital expenditure (FY21) Company No. 2 player PATM (%) 6 5 profitability and Working Capital /Sales (%) -8.3 -2.6 Cumulative Free Cash flow last 5 years (Rs. Cr.) 5,530 2,040 to Cumulative Capex past 5 years (Rs. Cr.) 17,364 10,286 Market share and volume growth (FY21) Company No. 2 Player Industry Market share (%) 47 17 100 Volume growth in 5 years (% CAGR) 0.4% -2.3% -2.2% Source: Companies filings, Motilal Oswal EBITDTA – Earnings before interest, depreciation, tax and amortization, PATM – Profit after Tax Margin, The above is to illustrate the concept of identifying stocks in the market. There is also a possibility of the expected event not happening or some other unforeseen event that may affect performance of the company. The performance of stocks would ultimately depend on various factors such as prevailing market conditions, global political scenario, exchange rate etc. Investors are requested to note that there are various factors (both local and international) that can have impact on the future performance and expectations of any company. Information given is available in public domain. There is no assurance or guarantee of any company being able to sustain its performance in future. There is no assurance or guarantee that the scheme would invest in this stock. Information Classification: UTI AMC - Private 9
Information Classification: UTI AMC - Private Competitive Franchise in B2B Sectors Client Revenue Contribution FY ‘22 IT Company 1 Others Information Technology Top 10 19% 36% - 59% Large client base Profitability Operating Efficiency FY ‘22 IT Company 1 IT Company 2 Others EBIT Margins 25% 23% 13% - 18% Source: Companies filings Pharma Improving quality of US Sales 34% Moving up the value chain Improving contribution of specialty pharma 27% 23% 25% 21% (Source: Kotak Inst. Equities) 16% 12% 12% 10% FY15 FY16 FY17 FY18 FY19 FY20 FY21 Speciality US Sales as % of overall US Sales The above is to illustrate the concept of identifying stocks in the market. There is also a possibility of the expected event not happening or some other unforeseen event that may affect performance of the company. The performance of stocks would ultimately depend on various factors such as prevailing market conditions, global political scenario, exchange rate etc. Investors are requested to note that there are various factors (both local and international) that can have impact on the future performance and expectations of any company. Information given is available in public domain. There is no assurance or guarantee of any company being able to sustain its performance in future. There is no assurance or guarantee that the scheme would invest in this stock. Information Classification: UTI AMC - Private 10
Information Classification: UTI AMC - Private Opportunities from Industry Consolidation Paints Paints Company Mar-02 Mar-20 Expansion Pricing Power & Improving profitability Gross Margin (%) 48.5 51.9 3.4 Despite Raw Material (crude based) moving up from $26/bbl in ‘02 to $54/bbl in ‘20 EBIT Margin (%) 11.8 16.7 4.9 Market share > 50% Telecom Entry of a new player eroded the revenue and profit pool by >30% Telecom Company No. of players reduced from 10 to 3 +1 Subscribers (Industry) Market share (Company) 1166 mn 31% Catalyst Tariff normalization, conversion of 2G subscribers to 4G, Reducing Capex intensity and path to FCF generation FCF – Free Cash Flow The above is to illustrate the concept of identifying stocks in the market. There is also a possibility of the expected event not happening or some other unforeseen event that may affect performance of the company. The performance of stocks would ultimately depend on various factors such as prevailing market conditions, global political scenario, exchange rate etc. Investors are requested to note that there are various factors (both local and international) that can have impact on the future performance and expectations of any company. Information given is available in public domain. There is no assurance or guarantee of any company being able to sustain its performance in future. There is no assurance or guarantee that the scheme would invest in this stock. Information Classification: UTI AMC - Private 11
Information Classification: UTI AMC - Private Avoiding the “wrong” stocks is as important as selecting the “right” ones Analysis of observations when S&P BSE 100 corrected >20% Fund’s NAV fell less than the fall in S&P BSE 100 generating Alpha on all these occasions For the smart investor who stayed through the turbulent period, the gains outsized the pain Corrections are opportunities if investment horizon is on your side Growth (Absolute) in UTI Mastershare’s NAV after drawdown In 3 Years 133% 69% 104% 104% 90% 50% NA Drawdown (Absolute) Duration (No. of Days) Downside Protection / Alpha Date From Date To UTI Mastershare -20% -30% -58% -16% -21% -21% -34% S&P BSE 100 -28% -31% -66% -23% -27% -23% -38% In 5 Years 138% 131% 129% 149% 97% 90% NA 08-Jan-04 10-May-06 16-Oct-07 04-Nov-08 05-Nov-10 03-Mar-15 17-Jan-20 17-May-04 14-Jun-06 27-Oct-08 09-Mar-09 20-Dec-11 25-Feb-16 23-Mar-20 130 35 377 125 410 359 66 8% 1% 8% 7% 6% 2% 4% Significant proportion of the Alpha is by being underweight on stocks that have relatively fallen more Information Classification: UTI AMC - Private 12 Source: MFIE, Scenarios of S&P BSE 100 falling more than 20%, data of last 15 years
Information Classification: UTI AMC - Private Investment Framework Growth at a Reasonable Price (GARP) (blend of both growth and value) 01 Investment Style Blend Approach 02 Stock/Sector Selection (Top-down for Sector selection & Bottom-up for Stock selection) Large Cap Dominance Min. of 80% of the fund corpus invested in large cap stocks 03 Market Cap Single Sector – Lower of 35% or Benchmark plus 12% Single Stock – Maximum of 10% Top 10 Stocks – Maximum of 55% 04 Internal Limits Low Churn 05 Portfolio Turnover Relatively lower churn portfolio Information Classification: UTI AMC - Private 5
Information Classification: UTI AMC - Private UTI Mastershare Unit Scheme – Fund Facts Type of scheme Investment Objective Large Cap Fund - An open ended equity scheme predominantly investing in large cap stocks The objective of the scheme is to generate long term capital appreciation by investing predominantly in equity and equity related securities of large cap companies. Fund Inception However, there can be no assurance or guarantee that the 15th October, 1986 investment objective of the scheme would be achieved. Fund Manager Asset Allocation Karthikraj Lakshmanan, CA, PGDBM (Managing since Sep-2022) Total Experience: 17 Years Indicative Allocation (% of total assets) Minimum Allocation (%) Risk Profile Instruments Maximum Allocation (%) Benchmark Equity & equity related instruments (minimum 80% of the total assets would be in equity and equity related instruments of large cap companies) Medium to High S&P BSE 100 TRI 80 100 Minimum Investment (Growth Option) Low to Medium Medium to High Debt and Money Market instruments including securitized debt# 0 20 ` 100/- and in multiples of `1/- Subsequent min. investment, `100/- and in multiples of `1/- 0 10 Units issued by REITs & InvITs #The fund may invest up to 50% of its debt portfolio in securitized debt. Information Classification: UTI AMC - Private 14
Information Classification: UTI AMC - Private Fund Facts (contd.) Portfolio Composition# Fund Snapshot Fund Size: Monthly Avg. AuM : ` 10,801 Crores Last Day AuM ROCE R1 R2 R3 OCF C1 C2 C3 : : : 55% 28% 17% : : : 91% 5% 4% : ` 10,659 Crores No. of Unit Folios : 7,56,211 Price to Book Market Capitalisation (%) 6.656.97 Fund 88 9 3 BM 96 4 0 Large Mid Small : : : Price to Earnings 32.36 36.52 Return on Equity Quantitative Indicators 18.42 16.83 Fund 0.93 20.79% 18.00% 0.39 BM 1.00 22.10% - - UTI Mastershare Unit Scheme S&P BSE 100 TRI Beta SD (3 Years) PTR (Annual) : Sharpe Ratio : : Active Share : 42.14% OCF – Operating Cash Flow; ROCE – Return on Capital Employed. #Operating Cash Flow Tiers (C)- 3 Tiers based on the number of years in which they have generated positive operating cash flows in the previous 5 years (for manufacturing companies). RoCE/ Implied RoE Tiers (R) - 3 Tiers based on the previous 5 year average return on capital (for manufacturing companies & non-lending non banking finance companies (NBFCs)) & based on the previous 5 year average return on asset for banks & NBFCs (including housing finance companies). All data are as of December 31, 2022 : No. of Stocks 49 Top 5 / Top10 Stocks 33.38% / 50.03% Avg. AuM – Average Asset under Management. All data as of December 31, 2022 Act. Wt % - Active Weight % (as compared to the Benchmark Index – S&P BSE 100 TRI) Information Classification: UTI AMC - Private 15
Information Classification: UTI AMC - Private Long-term trend of portfolio composition RoCE Tier OCF Tier 100% 100% 80% 80% 60% 60% 40% 40% 20% 20% 0% Dec-19 0% Dec-19 Jun-20 Dec-20 Jun-21 Dec-21 Jun-22 Dec-22 Jun-20 Dec-20 Jun-21 Dec-21 Jun-22 Dec-22 C1 C2 C3 R1 R2 R3 P/E Multiple (x) RoE P/B Multiple (x) 10 45 20 9 40 18 8 Multiple (x) Multiple (x) Multiple (x) 35 7 16 30 6 14 25 5 12 4 Dec-19 20 Dec-19 Jun-20 UTI Mastershare Dec-20 Jun-21 Dec-21 Benchmark Jun-22 Dec-22 Jun-20 UTI Mastershare Dec-20 Jun-21 Dec-21 Benchmark Jun-22 Dec-22 Dec-19 Jun-20 UTI Mastershare Dec-20 Jun-21 Dec-21 Benchmark Jun-22 Dec-22 UTI Mastershare (Average) Benchmark (Average) UTI Mastershare (Average) Benchmark (Average) UTI Mastershare (Average) Benchmark (Average) Information Classification: UTI AMC - Private 16 Data as of December 31, 2022, Benchmark – S&P BSE 100 TRI
Information Classification: UTI AMC - Private Portfolio Equity Top 20 Holdings Unique Stocks STOCK NAME SECTOR % To NAV Act. Wt % (As compared to Benchmark) ICICI BANK LTD FINANCIAL SERVICES 9.59 2.92 HDFC LTD. FINANCIAL SERVICES 7.52 2.37 INFOSYS LTD. IT 7.48 1.55 STOCK NAME SECTOR % to NAV AXIS BANK LTD. FINANCIAL SERVICES 4.45 1.67 SKF INDIA LTD. CAPITAL GOODS 2.07 BHARTI AIRTEL LTD. TELECOMMUNICATION 4.34 2.22 ADITYA BIRLA FASHION & RET CONSUMER SERVICES 1.43 RELIANCE INDUSTRIES LTD. OIL, GAS & CONS FUELS 4.11 -5.34 BALKRISHNA INDUSTRIES LTD. AUTO & AUTO COMPO 1.06 HDFC BANK LIMITED FINANCIAL SERVICES 4.08 -3.62 SAMVARDHANA MOTHERSON AUTO & AUTO COMPO 1.04 MARUTI SUZUKI INDIA LTD. AUTO & AUTO COMPO 2.87 1.67 METROPOLIS HEALTHCARE LTD HEALTHCARE 0.77 KOTAK MAHINDRA BANK LTD. FINANCIAL SERVICES 2.84 0.03 UNITED BREWERIES LTD. FMCG 0.75 TATA CONSULTANCY SERVICES IT 2.75 -0.84 MOTHERSON SUMI WIRING IND AUTO & AUTO COMPO 0.73 BAJAJ FINANCE LTD. FINANCIAL SERVICES 2.38 0.50 LARSEN & TOUBRO LTD. CONSTRUCTION 2.23 -0.48 3M INDIA LTD. DIVERSIFIED 0.65 SKF INDIA LTD. CAPITAL GOODS 2.07 2.07 INDIAN ENERGY EXCHANGE FINANCIAL SERVICES 0.65 EICHER MOTORS LTD AUTO & AUTO COMPO 1.96 1.48 FSN E-COMM VENTUR (NYKAA) CONSUMER SERVICES 0.59 TITAN COMPANY LTD. CONSUMER DURABLES 1.91 0.75 UNITED SPIRITS LTD. FMCG 0.57 ULTRATECH CEMENT LTD. CONSTRUCTION MAT 1.80 0.94 BLUE STAR LIMITED CONSUMER DURABLES 0.53 ICICI LOMBARD GEN INSURAN FINANCIAL SERVICES 1.74 1.43 CUMMINS INDIA LTD. CAPITAL GOODS 0.46 ASIAN PAINTS (INDIA) LTD. CONSUMER DURABLES 1.73 0.23 ZOMATO LTD CONSUMER SERVICES 0.20 AVENUE SUPERMARTS LTD. CONSUMER SERVICES 1.72 1.07 TOTAL 11.50 SUN PHARMACEUTICALS HEALTHCARE 1.70 0.54 Portfolio above shows Top 20 equity holdings under the scheme, for detailed portfolio visit www.utimf.com Act. Wt % - Active Weight % (as compared to the Benchmark Index – S&P BSE 100 TRI) Data as of December 31, 2022 Information Classification: UTI AMC - Private 17
Information Classification: UTI AMC - Private Portfolio Snippets Active Stock Position (As compared to Benchmark) Sectoral Breakdown (%) (As compared to Benchmark) Active Weight Overweight (Top 5) FINANCIAL SERVICES 35.75 0.25 IT 13.57 0.92 % to NAV 9.59 Act. Wt % 2.92 STOCK NAME SECTOR AUTO & AUTO COMPONENTS 9.27 4.58 CONSUMER DURABLES 5.33 1.96 ICICI BANK LTD FINANCIAL SERVICES CONSUMER SERVICES 4.95 2.94 HDFC LTD. FINANCIAL SERVICES 7.52 2.37 OIL, GAS & CONSUMABLE FUELS 4.73 -6.76 BHARTI AIRTEL LTD. TELECOMMUNICATION 4.34 2.22 HEALTHCARE 4.69 1.08 SKF INDIA LTD. CAPITAL GOODS 2.07 2.07 TELECOMMUNICATION 4.53 2.24 FMCG 2.62 -5.98 AXIS BANK LTD. FINANCIAL SERVICES 4.45 1.67 CAPITAL GOODS 2.53 1.41 CONSTRUCTION 2.23 -0.48 % to NAV Act. Wt % STOCK NAME SECTOR CONSTRUCTION MATERIALS 1.80 -0.64 CHEMICALS 1.26 -0.22 OIL, GAS & CONSUMABLE FUELS FINANCIAL SERVICES RELIANCE INDUSTRIES 4.11 5.34 METALS & MINING 0.92 -3.08 SERVICES HDFC BANK LTD 4.08 3.62 0.75 -0.10 DIVERSIFIED 0.65 0.65 ITC LTD. FMCG - 3.14 POWER 0.56 -1.70 HINDUSTAN UNILEVER LTD FMCG - 2.46 TEXTILES 0.00 -0.27 MAHINDRA & MAHINDRA AUTO & AUTO COMPONENTS - 1.28 REALTY 0.00 -0.40 MEDIA, ENTERT & PUBLICATION 0.00 -0.25 Underweight (Top 5) 0 10 20 30 40 50 60 70 UTI - Mastershare Unit Scheme Information Classification: UTI AMC - Private Data as of December 31, 2022. 18
Information Classification: UTI AMC - Private Portfolio Commentary Consumer Durables/Services: The Fund has an overweight stance given the potential for long growth runway from low penetration, changing lifestyles, improving working age population, brand strength power. The Fund’s emphasis is on high RoCE businesses which have sustaining the earnings growth rather than valuation re-rating. Financial Services: The Fund continues to prefer banks with healthy liability franchise i.e., low- cost CASA balances which help in better spreads. The valuations are at reasonable levels and NPAs are at their decade low. The Fund continues to ride on expectations of improving medium term growth and valuation comfort. and pricing the potential of Information placed to capture the technology wave of digitization spend. The macro concerns in the US and Europe have led valuations to turn reasonable. The overweight position in the sector is led by High RoCE, consistent cash flows and visibility on medium term growth Technology: The sector is well FMCG: Given the lacklustre volume growth and expensive valuations, the Fund continues to be underweight in the sector. Automobile & Automobile Components: The Fund continues to maintain its overweight stance in the sector improvement in component supply issues and improving demand. The demand outlook for the medium to long term remains supported by low penetration, replacement demand, rising aspirations, etc. Healthcare: The Fund is overweight in the sector considering the steady growth in domestic formulations particularly chronic therapeutic area. The Fund focuses on companies with higher export potential in complex generic and specialty pharma and CRAMS. driven by gradual CASA – Current Account Savings Account; NPA – Non Performing Assets; RoCE – Return on Capital Employed; CRAMS – Contract Research & Manufacturing Services; FMCG – Fast Moving Consumer Goods Information Classification: UTI AMC - Private 19
Information Classification: UTI AMC - Private A Journey of Wealth Creation (35+ Years) Growth of ` ` 10 Lakhs invested at Scheme Inception# UTI Mastershare Unit Scheme ` 10 lakhs invested at inception now worth ` 18.64 Crore, > `6.15 Crore vs the benchmark S&P BSE 100 of ` 12.49 Crore Each correction may have been painful for the short-term investor, but an opportunity to make higher returns for the long-term investor 2000000 ` ` 18.64 Crores CAGR – 15.52% 1800000 1600000 1400000 ` ` 12.49 Crores CAGR – 14.25% 1200000 1000000 800000 600000 400000 200000 0 Dec-88 Dec-99 Dec-10 Dec-86 Dec-87 Dec-89 Dec-90 Dec-91 Dec-92 Dec-93 Dec-94 Dec-95 Dec-96 Dec-97 Dec-98 Dec-00 Dec-01 Dec-02 Dec-03 Dec-04 Dec-05 Dec-06 Dec-07 Dec-08 Dec-09 Dec-11 Dec-12 Dec-13 Dec-14 Dec-15 Dec-16 Dec-17 Dec-18 Dec-19 Dec-20 Dec-21 Dec-22 UTI Mastershare Unit Scheme S&P BSE 100 TRI Fund Performance as of December 31, 2022 *Assuming all IDCWs were reinvested at the immediate ex-IDCW option NAV, all bonuses were availed and all right offers were availed, if any. NAVs of IDCW option for the period where growth option was not available and NAVs of growth option thereafter is considered. As TRI values are not available since inception of the scheme, benchmark performance is calculated using composite CAGR of S&P Sensex PRI values from 15-10-1986 to 31-12-1990 and S&P BSE 100 TRI values thereafter.CAGR – Compounded Annualized Growth Rate Information Classification: UTI AMC - Private 20
Information Classification: UTI AMC - Private Rolling Return Analysis Rolling Returns of UTI Mastershare Unit Scheme: 15 Years Lowest Highest Median 110% 90% 90% 70% 50% 27% 20% 30% 17% Median Rolling Returns (CAGR) 13% 6% 12% 11% 12% 10% -1% -10% -5% -30% -50% -51% -70% 1 Year 3 Years 5 Years 10 Years Instances of -ve Returns 0.0% 0.2% 21.4% 2.3% Over 8% 94.9% 57.2% 83.9% 72.4% Rolling Returns with daily frequency of UTI Mastershare Unit Scheme at difference time frame as mentioned above. CAGR – Compounded Annual Growth Rate.Data period: December 31, 2007 to December 31, 2022. Different plans have a different expense structure. The performance details provided herein are of regular plan. Past performance may or may not be sustained in future. Information Classification: UTI AMC - Private 21
Information Classification: UTI AMC - Private Performance Track Record UTI Mastershare Unit Scheme Performance Vs Benchmark as of 31/12/2022 Fund Performance Vs Benchmark Scheme Returns (%) -1.80 14.71 16.15 10.73 12.27 15.52 14.25 Growth of ` ` 10,000/- B: S&P BSE 100 TRI (` `) 10,603 15,676 17,842 12,48,765 Period B: S&P BSE 100 TRI (%) 6.03 AB: S&P BSE Sensex TRI (%) 5.80 15.15 13.62 14.97 Scheme Returns (` `) 9,820 15,100 16,651 18,63,891 AB: S&P BSE Sensex TRI (` `) 10,580 15,274 18,942 15,67,382 1 Year 3 Years 5 Years Since Inception* B - Benchmark, AB - Additional Benchmark, TRI - Total Return Index Past performance may or may not be sustained in future. Different plans shall have a different expense structure. The performance details provided herein are of regular plan (growth option). Returns greater than 1 year period are Compound Annual Growth Rate (CAGR). Inception of UTI Mastershare Unit Scheme - October 15, 1986. Date of allotment in the scheme/plan has been considered for inception date. The Scheme is currently managed by Mr. Karthikraj Lakshmanan since Sep 2022. Period for which scheme’s performance has been provided is computed basis last day of the month-end preceding the date of advertisement. In case, the start/end date of the concerned period is a non-business day, the NAV of the previous date is considered for computation of returns. *Assuming all IDCWs were reinvested at the immediate ex-IDCW NAV, all bonuses were availed and all right offers were availed, if any. NAVs of IDCW option for the period where growth option was not available and NAVs of growth option thereafter is considered. As TRI values are not available since inception of the scheme, benchmark performance is calculated using composite CAGR of S&P Sensex PRI values from 15-10-1986 to 31-12-1990 and S&P BSE 100 TRI values thereafter. Performance of other open-ended schemes managed by the Fund Manager Mr. Karthikraj Lakshmanan Managing the Fund Since UTI MNC Fund 29-May-98 Jun-04 Nifty MNC TRI 1 Year (%) 3 Years (%) 5 Years (%) Inception Date Scheme Benchmark Fund Benchmark Fund Benchmark Fund Benchmark -1.44 3.83 11.36 14.28 6.25 7.50 a. Mr. Karthikraj Lakshmanan manages 2 open-ended schemes of UTI Mutual Fund. b. Date of allotment in the scheme/plan has been considered for inception date. c. Period for which scheme’s performance has been provided is computed basis last day of the month-end preceding the date of advertisement. d. Different plans shall have a different expense structure. The performance details provided herein are of Growth Option (Regular Plan). Information Classification: UTI AMC - Private 22
Information Classification: UTI AMC - Private Income Distribution /Bonus/ Rights History Cum-Div NAV (` `) Cum-Div NAV (` `) Year Inc. Dist. (%) Record Date Per Unit Year Inc. Dist. (%) Record Date Per Unit 1987 8.00 11.05 0.80 1999 16.00 22.62 1.60 29-Jun-87 25-Aug-99 1988 13.00 14.70 1.30 2000 16.00 17.14 1.60 30-Jun-88 17-May-00 1989 18.00 29.45 1.80 2001 10.00 10.34 1.00 30-Jun-89 3-Oct-01 1990 18.00 26.52 1.80 2002 10.00 11.13 1.00 4-Jun-90 11-Oct-02 1991 18.00 36.00 1.80 2003 14.00 14.54 1.40 28-Jun-91 18-Sep-03 1992 18.00 50.00 1.80 2004 20.00 18.90 2.00 24-Jun-92 24-Sep-04 1993 18.00 57.60 1.80 2005 25.00 23.47 2.50 24-Nov-93 20-Oct-05 1994 20.00 37.97 2.00 2006 30.00 29.77 3.00 27-Jul-94 10-Nov-06 1995 16.00 29.78 1.60 2007 35.00 42.75 3.50 14-Jun-95 7-Nov-07 1996 16.00 24.16 1.60 2008 22.00 20.93 2.20 28-Aug-96 23-Oct-08 1997 16.00 24.76 1.60 2009 27.00 28.65 2.70 20-Aug-97 30-Oct-09 1998 16.00 15.76 1.60 2010 30.00 34.04 3.00 19-Aug-98 15-Nov-10 2011 22.00 28.02 2.20 31-Oct-11 1:2 Jan '89 Rights Offer 2012 22.00 27.36 2.20 15-Nov-12 1:1 Dec '93 2013 22.50 27.33 2.25 29-Oct-13 1:2 Jul '91 2014 27.50 35.54 2.75 5-Nov-14 Bonus 1:3 Dec '93 2015 28.00 33.39 2.80 16-Nov-15 1:5 Aug ’95 2016 30.00 33.55 3.00 8-Nov-16 2017 35.00 35.44 3.50 16-Oct-17 35 Income Distribution Pay-outs in last 36 years with Total Income Distribution of 733% | ` ` 73.30 per unit Distributed over ` ` 4,300 Crores of income (since 2003) 2018 27.00 32.15 2.70 15-Nov-18 2019 26.00 32.42 2.60 17-Oct-19 2020 16.00 31.24 1.60 05-Nov-20 2021 27.00 46.92 2.70 01-Nov-21 2022 12.00 49.20 1.20 03-Nov-22 Pursuant to payment of Income Distribution/ bonus/ right, the NAV of the IDCW Option (Regular / Direct Plan) of the scheme would fall to the extent of the payout and statutory levy (if applicable). Past performance may or may not be sustained in future. Face Value per unit is `10/- Information Classification: UTI AMC - Private
Information Classification: UTI AMC - Private Why Invest in UTI Mastershare Unit Scheme? India’s first equity-oriented fund launched in October 1986 The Fund invests in large capitalisation companies with competitive advantages by following Growth at Reasonable Price (GARP) investment style The Fund takes a top-down view for sector active weights and then uses bottom- up approach for stock selection The Fund maintains a well-diversified portfolio and avoids sector as well as stock concentration Suitable for: Investors who wish to own large cap stocks in their portfolio of businesses with sound management capabilities having steady cash flows, earnings growth and bought at a reasonable price Investors looking to build their core equity portfolio for steady and long-term wealth creation Information Classification: UTI AMC - Private 24
Information Classification: UTI AMC - Private Product Label Riskometer of Benchmark S&P BSE 100 TRI Name of the Scheme This product is suitable for investors who are seeking* Riskometer of Fund# UTI Mastershare Unit Scheme (An open ended equity scheme predominantly investing in large cap stocks) • Long term capital appreciation • Investment predominantly in equity instruments of large cap companies Nifty Large Midcap 250 TRI UTI Core Equity Fund (An open ended equity scheme investing in both large cap and mid cap stocks) • Long term capital appreciation • Investment predominantly in equity instruments of both large cap and mid cap companies Nifty Midcap 150 TRI UTI Mid Cap Fund (An open ended equity scheme predominantly investing in mid cap stocks) • Long term capital appreciation • Investment predominantly in mid cap companies Nifty 500 TRI UTI Value Opportunities Fund (An open ended equity scheme following a value investment strategy) • Long term capital appreciation • Investment in equity instruments following a value investment strategy across the market capitalization spectrum Nifty 500 TRI UTI Flexi Cap Fund (An open ended dynamic equity scheme investing across large cap, mid cap, small cap stocks) • Long term capital appreciation • Investment in equity instruments of companies with good growth prospects across the market capitalization spectrum Nifty Small Cap 250 TRI UTI Small Cap Fund (An open ended equity scheme predominantly investing in small cap stocks) • Long term capital appreciation • Investment predominantly in equity and equity related securities of small cap companies Nifty 500 TRI UTI Dividend Yield Fund (An open ended equity scheme predominantly investing in dividend yielding stocks) • Long term capital appreciation • Investment predominantly in dividend yielding equity and equity related securities Nifty 500 TRI UTI Focused Equity Fund (An open ended equity scheme investing in maximum 30 stocks across market caps) • Long term capital growth • Investment in equity and equity related securities across market capitalisation in maximum 30 stocks *Investors should consult their financial advisers if in doubt about whether the product is suitable for them. #Risk-o-meter for the fund is based on the portfolio ending December 31, 2022. The Risk-o-meter of the fund/s is/are evaluated on monthly basis and any changes to Risk-o-meter are disclosed vide addendum on monthly basis, to view the latest addendum on Risk-o-meter, please visit addenda section on https://utimf.com/forms-and-downloads/ Information Classification: UTI AMC - Private
Information Classification: UTI AMC - Private Product Label Riskometer of Benchmark Nifty Infrastructure TRI Name of the Scheme This product is suitable for investors who are seeking* Riskometer of Fund# • Long term capital appreciation • Investment predominantly in equity and equity related securities of companies forming part of the infrastructure sector UTI Infrastructure Fund (An open ended equity scheme following the Infrastructure theme) Nifty MNC TRI UTI MNC Fund (An open ended equity following the theme of investing predominantly in equity and equity related securities of Multi-National Companies) UTI India Consumer Fund (An open ended equity scheme following the theme of changing consumer aspirations, changing lifestyle and growth of consumption) • Long term capital appreciation • Investment predominantly in equity and equity related securities of Multi-National companies Nifty India Consumption TRI • Long term capital growth • Investment in equity instruments of companies that are expected to benefit from of the changing consumer aspirations, changing lifestyle and growth of consumption • Long term capital appreciation • Investment predominantly in equity and equity related securities of companies engaged in banking and financial services activities. Nifty Financial Services TRI UTI Banking and Financial Services Fund (An open ended equity scheme investing in Banking and Financial Services Sector) S&P BSE Healthcare TRI UTI Healthcare Fund (An open ended equity scheme investing in the Healthcare Services Sector) • Long term capital appreciation • Investment predominantly in equity and equity related securities in the Healthcare Services sector. Nifty Transportation & Logistrics TRI • Long term capital appreciation • Investment predominantly in equity and equity related securities of the companies engaged in the transportation and logistics sector UTI Transportation and Logistics Fund (An open ended equity scheme investing in transportation and logistics sector) Nifty 500 TRI UTI Long Term Equity Fund (Tax Saving) (An open ended equity linked saving scheme with a statutory lock in of 3 years and tax benefit) • Long term capital growth • Investment in equity instruments of companies that are believed to have growth potential *Investors should consult their financial advisers if in doubt about whether the product is suitable for them. #Risk-o-meter for the fund is based on the portfolio ending December 31, 2022. The Risk-o-meter of the fund/s is/are evaluated on monthly basis and any changes to Risk-o-meter are disclosed vide addendum on monthly basis, to view the latest addendum on Risk-o-meter, please visit addenda section on https://utimf.com/forms-and-downloads/ Information Classification: UTI AMC - Private
Information Classification: UTI AMC - Private Thank You The information contained in this document is for general purposes only and is not an offer to sell or a solicitation to buy/ sell any mutual fund units / securities. The information / data here in alone are not sufficient and should not be used for the development or implementation of an investment strategy. The same should not be construed as investment advice to any party. The information on this document is provided for information purposes only. It does not constitute any offer, recommendation or solicitation to any person to enter into any transaction or adopt any hedging, trading or investment movements in rates or prices or any representation that any such future movements will not exceed those shown in any illustration. Users of this document should seek advice regarding the appropriateness of investing in any securities, financial instruments or investment strategies referred to on this document and should understand that statements regarding future prospects may not be realized. The recipient of this material is solely responsible for any action taken based on this material. Opinions, projections and estimates are subject to change without notice. strategy, nor does it constitute any prediction of likely future UTI AMC Ltd is not an investment adviser, and is not purporting to provide you with investment, legal or tax advice. UTI AMC Ltd or UTI Mutual Fund (acting through UTI Trustee Company Pvt. Ltd) accepts no liability and will not be liable for any loss or damage arising directly or indirectly (including special, incidental or consequential loss or damage) from your use of this document, howsoever arising, and including any loss, damage or expense arising from, but not limited to, any defect, error, imperfection, fault, mistake or inaccuracy with this document, its contents or associated services, or due to any unavailability of the document or any part thereof or any contents or associated services. REGISTERED OFFICE: UTI Tower, ‘Gn’ Block, Bandra Kurla Complex, Bandra (E), Mumbai - 400051. Phone: 022 – 66786666. UTI Asset Management Company Ltd (Investment Manager for UTI Mutual Fund) Email: invest@uti.co.in . (CIN-L65991MH2002PLC37867). For more information, please contact the nearest UTI Financial Centre or your AMFI/NISM certified Mutual Fund Distributor (MFD) for a copy of the Statement of Additional Information, Scheme Information Document and Key Information Memorandum cum Application Form. Mutual Fund Investments are subject to market risks, read all scheme related documents carefully. Mutual Fund Investments are subject to market risks, read all scheme related documents carefully. Information Classification: UTI AMC - Private