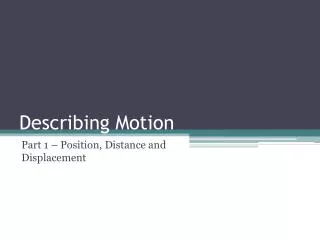
Describing Motion with Diagrams
120 likes | 320 Views
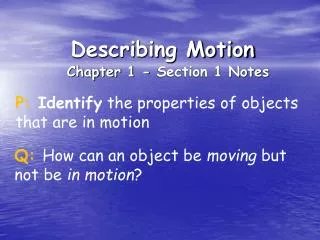
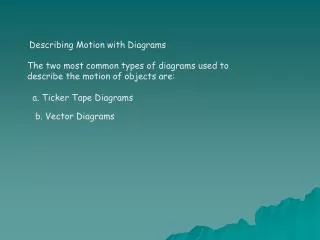
Describing Motion with Diagrams. The two most common types of diagrams used to describe the motion of objects are:. a. Ticker Tape Diagrams. b. Vector Diagrams. Ticker Tape Diagrams.

Describing Motion with Diagrams
E N D
Presentation Transcript
Describing Motion with Diagrams The two most common types of diagrams used to describe the motion of objects are: a. Ticker Tape Diagrams b. Vector Diagrams
Ticker Tape Diagrams A long tape is attached to a moving object and threaded through a device that places a tick upon the tape at regular intervals of time – say every 0.1 second. As the object moves, it drags the tape through the "ticker," thus leaving a trail of dots. The trail of dots provides a history of the object's motion and is therefore a representation of the object's motion.
The distance between dots on a ticker tape represents the object's position change during that time interval. A large distance between dots indicates that the object was moving fast during that time interval. A small distance between dots means the object was moving slow during that time interval. Ticker tapes for a fast-moving and a slow-moving object are depicted below.
The analysis of a ticker tape diagram will also reveal if the object is moving with a constant velocity or with a changing velocity (accelerating). A changing distance between dots indicates a changing velocity and thus an acceleration. A constant distance between dots represents a constant velocity and therefore no acceleration. Ticker tapes for objects moving with a constant velocity and an accelerated motion are shown below. Check Your Understanding
Vector Diagrams Vector diagrams are diagrams which use vector arrows to depict the direction and relative magnitude of a vector quantity. In a vector diagram, the magnitude of the vector is represented by the size of the vector arrow. If the size of the arrow in each consecutive frame of the vector diagram is the same, then the magnitude of that vector is constant.
The diagrams below depict the velocity of a car during its motion. Vector diagrams can be used to represent any vector quantity. In future studies, vector diagrams will be used to represent a variety of physical quantities such as acceleration, force, and momentum.