Acceleration
Acceleration. Measuring motion. By Vinesh Vora Andrew Jaisingh. Acceleration. Acceleration = speeding up Acceleration – the rate at which velocity changes Can be an: Increase in speed Decrease in speed Change in direction. Types of acceleration. Increasing speed

Acceleration
E N D
Presentation Transcript
Acceleration Measuring motion By VineshVora Andrew Jaisingh
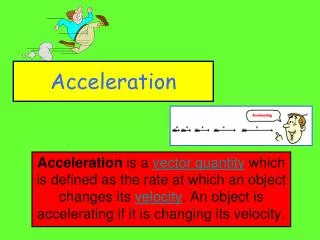
Acceleration • Acceleration = speeding up • Acceleration – the rate at which velocity changes • Can be an: • Increase in speed • Decrease in speed • Change in direction
Types of acceleration • Increasing speed • Example: Car speeds up at green light • Decreasing speed • Example: Car slows down at stop light • Changing Direction • Example: Car takes turn (can be at constant speed) screeeeech
Question • How can a car be accelerating if its speed is a constant 65 km/h? • If it is changing directions it is accelerating
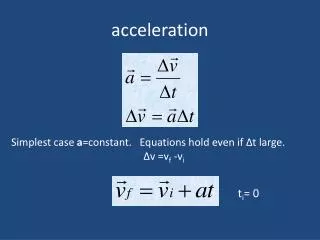
Calculating Acceleration • If an object is moving in a straight line • Units of acceleration: • m/s2
Calculating Acceleration 1 s 2 s 3 s 4 s 0 s 4 m/s 12 m/s 16 m/s 0 m/s 8 m/s
Question • A skydiver accelerates from 20 m/s to 40 m/s in 2 seconds. What is the skydiver’s average acceleration?
Graphing Acceleration • Can use 2 kinds of graphs • Speed vs. time • Distance vs. time
Graphing Acceleration:Speed vs. Time Graphs • Speed is increasing with time = accelerating • Line is straight = acceleration is constant
Graphing Acceleration:Speed vs. Time Graphs Rise = 4 m/s Run = 2 s • In Speed vs. Time graphs: • Acceleration = Rise/Run • = 4 m/s ÷ 2 s = 2 m/s2
Graphing Acceleration:Distance vs. Time Graphs • On Distance vs. Time graphs a curved line means the object is accelerating. • Curved line also means your speed is increasing. Remember slope = speed.
Area under a graph • The area under a velocity-time graph shows the distance an object has traveled. • In order to find the distance (m), multiply the velocity (m/s) by the time (s). • Area=(base)(height) =(time)(velocity) =distance • When the area under the velocity-time graph is a right triangle, the area is found using the equation. • Area=1/2base X height
Question: • What is the total distance traveled by the bus during the first 10 seconds?
Answer: • First, calculate the first 5 seconds, which is a right-triangle. Area=1/2base X height =1/2(5m)(10m/s) =25m • Next, calculate the last 5 seconds, which is a rectangle. • Area=(base)(height) =(time)(velocity) =(5s)(10m/s) =50m • Last, add the two totals to get the entire area under the graph, which is your total distance. • 25m+50m=75m • Answer=75m
Question Run = 3 s Rise = -6 m/s Above is a graph showing the speed of a car over time. 1) How is the speed of the car changing (speeding up, Slowing down, or staying the same)? 2) What is this car’s acceleration? • The car is slowing down • Acceleration = rise/run = -6m/s ÷3s = -2 m/s2
Question: The black and red lines represent a objects that are accelerating. Black is going a greater distance each second, so it must be speeding up. Red is going less each second, so must be slowing down Remember: in distance vs. time graphs: curved line = accelerating, flat line = constant speed • Which line represents an object that is accelerating?
Question: Hard one Above is a graph showing the speed of a car over time. 1)What would a distance vs. time graph for this look like?
Slopes of graphs reveal how objects move Because the plane is moving at a constant velocity, its acceleration is zero. It is called non-uniform motion because the object’s speed or direction is changing.
Video http://www.youtube.com/watch?v=hD0ineZXpcw