Technology Use Across Different Income Groups
280 likes | 352 Views
Explore how technology adoption varies among different income groups based on Pew Research data. Analyze internet and mobile device usage, online activities, and connectivity trends to understand the digital divide.

Technology Use Across Different Income Groups
E N D
Presentation Transcript
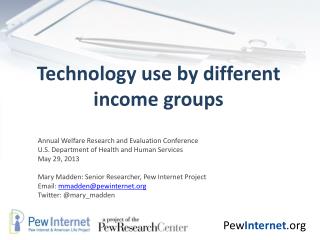
Technology use by different income groups Annual Welfare Research and Evaluation Conference U.S. Department of Health and Human Services May 29, 2013 Mary Madden: Senior Researcher, Pew Internet Project Email: mmadden@pewinternet.org Twitter: @mary_madden
Which Pew are you? • Part of the Pew Research Center, a nonpartisan “fact tank” based in DC. • PRC’s mission: provide high quality, impartial research that is freely available to the public • Data from nationally representative telephone surveys of U.S. adults (on landlines and cell phones) • For 13+ years of tech use data: www.pewinternet.org
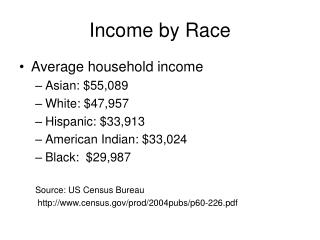
Keep in mind… Low income = <30K in HH income/per yr - 10-15% respondents don’t report income • Lower levels of education • Higher proportion of young adults + seniors More likely to be: • African-American or Hispanic • Living in rural areas
Mobile devices are changing the way we think about connectivity…
“Cell-mostly” internet use • 31% of cell internet users do most of their online browsing on their phones Less than $30K = 43%* $30K-50K = 36%* $50-75K = 24% Over $75K = 21%
Health information in past 12 months% of internet users in September 2012
SNS – 67% of internet usersDecember 2012 Less than $30K = 72% $30K-50K = 65% $50-75K = 66% Over $75K = 66%
Use social networking site on phone% of cell users in April 2012
Get health information on phone% of cell users in April 2012
Thanks! Mary Madden: Senior Researcher, Pew Internet Project Email: mmadden@pewinternet.org Twitter: @mary_madden