Download
1 / 25
250 likes | 266 Views
Integromics is a platform designed to integrate and analyze bioinformatics data and tools, with a focus on cancer research. It aims to improve the efficiency and quality of work in genomics analysis by providing standardized and repeatable methodologies.

E N D
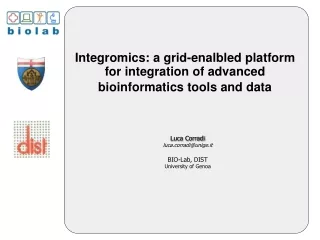
Integromics: a grid-enalbled platform for integration of advanced bioinformatics tools and data Luca Corradiluca.corradi@unige.itBIO-Lab, DISTUniversity of Genoa
Integromics Cancer research goal: tailor treatment to the molecular profile of an individual patient's tumor Microarrays and other 'omic' technologies allow to study tens of thousand of genes simultaneously Tools and methodologies used lack of standardization and repeatability Need of an "integromic" platform to: Develop integrative ('integromic') analyses of the data Combine tools available for genomics Better results, higher quality of work
Focus on... How to exploit the backend gLite infrastructure and a HPC environment to integrate bioinformatics tools and data How a Grid Portal can: integrate heterogeneous tools and data simplify user interaction through customized web interfaces increase usability and efficiency Case study: example of correlation between genomics data and clinical data through a combination of processing tools provided by the platform
The challenges Manage large volumes of bioinformatics data Deal with complex issues as different formats, distributed locations, time-consuming tasks, computational needs Integrate heterogeneous tools and platforms Speed up analysis process through automated metodologies Improve efficiency and quality of work Make the system usable and accessible
Microarray technology Computation of genes expression values of thousands genes at the same time Collection of microscopic DNA spots, representing single genes, arrayed on a solid surface by covalent attachment to chemically suitable matrices Estimation of the absolute value of gene expression
Analyse large microarray datasets for breast cancer prognosis assessment Run several R/Bioconductor scripts Deploy a re-usable and reliable service Avoid errors, increase repeatability Create a processing pipeline where new algorithms and data analysis techniques can be tested Create a set of “atomic” components that can be combined into workflows The use case
Data Analysis Tools R/Bioconductor Free software environment for statistical computing and graphics Bioconductor is a series of R packages specific for bioinformatics community Active user community Dchip Free software for analysis and visualization of gene expression data Affymetrix Power Tools (APT) . Cross-platform command line programs that implement algorithms for analyzing Affymetrix GeneChip arrays
Parallel dChip execution Module 1 n jobs each opening N/n Files and normalizing them Each job produces N/n CSV Files (matching with input files) Module 2 m jobs each opening all N CSV Files and computing genes expression values concerneing a certain group of genes Each job produces one CSV File Module 3 One job opening the m expression files It searches for differentially expressed genes and it performs clustering of results CEL N/n CEL N CEL 1 Mod1 2 Mod1 1 Mod1 n CSV 1 CSV N Mod2 1 Mod2 2 Mod2 m Mod3 CSV m CSV 1 CSV 2
Analyze large microarray datasets for breast cancer prognosis assessment Concatenate phenodata and expression results Mix of custom and R programs Automatic analysis and plot creation The service
The BioMedicalPortal Based on EnginFrame, an industry proven production-grade grid-portal (public/private academic and industry customer worldwide)
BMPortal Architecture Client Apps NON-Grid users Grid Users gLite WLM Secure Storage Web Service Interface BM Portal Engin Frame GSAF AMGA Grid APIs Clusters (LSF, PBS, LL, etc..) User Web Interface AMGA local Other Grids NorduGrid, Globus, SRB, AliEn, etc… • based on EnginFrame product from NICE srl • data management and secure storage layerare based on GSAF / Secure Storage APIs other Grid DBs
BioMedicalPortal services User management, authentication and authorization services Data management (extension to metadata support on GRID) Job submission (GRID, local, remote cluster) and monitoring Support for every programming and scripting language Plugin strategy for applications integration Web services interface Workflow management system Lots of software and applications already integrated etc......
gLite plugin & GWT • Authentication, Authorization using VOMS (client side applet is coming) • Job submission and monitoring, retrieve and result visualization • Preference settings (RB, CE, …) • Traditional LFC based data management • New Google Web Toolkit interfaces for GSAF integration via Java API using VOMS credentials
User submits and monitor work via a standard web browser 1 BMPortal checks input parameters and files, and submits a job to gLite 6 2 8 Streaming output allows to monitor the progress of the job User can check the job status, exit results or messages The RB matches the user requirements with the available resources on the Grid 3 5 Results are written to the input file directory 7 Job is done The job starts 4 Testbed architecture Users Win LX BMPortal Mac UX Users gLite UI EF Server&Agent Input files - primary - include Local or remote cluster (LSF) EGEE gLite infrastructure Application
EnginFrame Grid portal interface (web access) Input data selection (Affy .CEL files, phenodata, gene list) Analysis /1
Analysis /2 • Services execution & monitoring • Users can come back after coffee
Result visualization in portal spooler area (txt files, images, etc.) Analysis /3
Impact Addressed to bio-medical researchers without specific computation skills The collaboration between molecular oncologists and software engineers allowed for the optimization of the system without loosing flexibility Scales up in the size of processed data above current available Desktop Personal computer limitations Following the Software as a Service paradigm, users can focus on experimental design rather than infrastructure.
Each processing step is an “atomic” service Services can be invoked one by one Now services are composed using EnginFrame portal features and LSF scheduler tools But… Atomic services
Current work (1) • Viasual and easy WFmonitoring • Totally integrated with the EnginFrame job monitoring and data access • Useful for very long lasting workflows • User-designed “virtual experiments
Current work (2) Integration of new algorithms (multi-chip quality control, across-platform data integration, etc...)
Current work (3) Possibility to perform different analyses in a parallel way
Acknowledgements Part of this work is developed within the Italian FIRB project LITBIO (Laboratory for Interdisciplinary Technologies in BlOinformatics). Thanks are due to Ulrich Pfeffer and his functional genomics group at IST (National Institute for Cancer Research) of Genoa, Italy for their support.
Thank you! Thank you!