Predator-Prey Models
Predator-Prey Models. Pedro Ribeiro de Andrade Gilberto Câmara. Acknowledgments and thanks. Many thanks to the following professors for making slides available on the internet that were reused by us Abdessamad Tridane (ASU) Gleen Ledder (Univ of Nebraska)


Predator-Prey Models
E N D
Presentation Transcript
Predator-Prey Models Pedro Ribeiro de Andrade Gilberto Câmara
Acknowledgments and thanks • Many thanks to the following professors for making slides available on the internet that were reused by us • Abdessamad Tridane (ASU) • Gleen Ledder (Univ of Nebraska) • Roger Day (Illinois State University)
hare and lynx populations (Canada) Note regular periodicity, and lag by lynx population peaks just after hare peaks
The principal cause of death among the prey is being eaten by a predator. The birth and survival rates of the predators depend on their available food supply—namely, the prey. Predator-prey systems
Two species encounter each other at a rate that is proportional to both populations Predator-prey systems
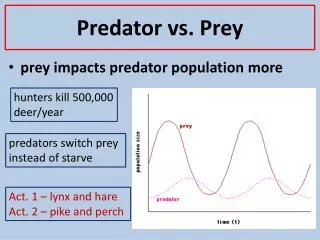
prey population increases prey population increases predator population decreases as less food predator population increases as more food prey population decreases because of more predators Predator-prey cycles normal prey population
Generic Model • f(x) prey growth term • g(y) predator mortality term • h(x,y) predation term • e - prey into predator biomass conversion coefficient
Lotka-Volterra Model r - prey growth rate : Malthus law m - predator mortality rate : natural mortality a and b predation coefficients : b=ea e prey into predator biomass conversion coefficient
Predator-prey population fluctuations in Lotka-Volterra model
Suppose that populations of rabbits and wolves are described by the Lotka-Volterra equations with: k = 0.08, a = 0.001, r = 0.02, b = 0.00002 The time t is measured in months. There are 40 wolfes and 1000 rabbits Predator-prey systems
Variation of one species in relation to the other Phase plane
A phase trajectory is a path traced out by solutions (R, W) as time goes by. Phase trajectories: solution curve
The point (1000, 80) is inside all the solution curves. It corresponds to the equilibrium solution R = 1000, W = 80. Equilibrium point