Download
1 / 59
590 likes | 703 Views
Livestock Outlook: Imbalances in the Market. Dr. Thomas E. Elam President FarmEcon LLC March 1, 2008. First, we need to make sure we are all on the same level of reading comprehension!. First, we need to make sure we are all on the same level of reading comprehension!. What is this data?.

E N D
Livestock Outlook:Imbalances in the Market Dr. Thomas E. Elam President FarmEcon LLC March 1, 2008
First, we need to make sure we are all on the same level of reading comprehension!
First, we need to make sure we are all on the same level of reading comprehension!
Bottom line: A deteriorating balance of higher costs, increasing production, and a more difficult demand growth scenario. 2008 Outlook
Like 1972-76? • Unprecedented increase in grain demand • Food price inflation becomes an issue • Huge imbalances in the ag economy • Farm income/land prices explode • But, this time around: • Different cause – biofuels subsidies • No reserve acres
Food price inflation rate Beef & pork price increases yet to come
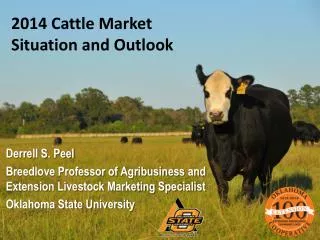
Imbalances • Feed costs are headed higher, personal income growth slowing • But total meat production increasing • Corn acres likely to drop • But ethanol capacity up 40-50% by year end • Dollar not likely to strengthen • Grain export demand likely to increase
USDA total meat production fcst. +2.4% +1.8%
Light at the end of the tunnel? Yes! • Hint: It’s not the sun (or the moon) • Profitability for hogs and cattle bad, and getting worse • 2008-09 macro outlook not good • Only apparent solution = less meat • How much less and how soon?
Hogs • Production seems headed 3-5% higher • Costs will continue to increase • Already losing $35+/head • With current outlook, losses increase • Only question, when does liquidation really get underway?
Comm. Pork vs. CME Lean Target for profitability
Farrow/finish net returns/head(Iowa State model, 7/08 FarmEcon fcst.)
What needs to happen • Pork production needs to drop to about 20 to 20.5 billion pounds (-10%) • Forecasts for 2008 up 3-4%: • USDA = 23.065 • Informa = 22.852 • Plain and Grimes = ~22.9 • No signs of major liquidation (yet)
Cattle outlook not any better • Record-large on-feed (12,097,000) • Feedlot losses mounting, more pressure on feeder prices • Liquidation takes years to show up • Feeder cattle prices taking a hit now • Cow budgets showing losses • Slow liquidation (-.5% Jan. 1, 2008 cows) • Feeder cattle supply same as 2007 • Beef output will not drop until 2009-11
Beef supply/demand outlook • 2008 production up about 1% • Exports could absorb most of the increase • Estimated production splits by quarter • Q1 +2 to +3% • Q2 -1 to -2% • Q3 +.5 to -.5% • Q4 +2% to +3% • 1/1/2009 beef cow number -1% to -2%?
Bright spot – beef and pork exports • Beef export demand recovery • Volume and price both increasing • Average export value/lb. above 2003 • Pork export demand growth • Volume almost double 2002 • Value/lb. up 10% since 2002
It’s not ALL Ethanol • Ending global grain stocks trending down from 2001 • Economic growth adding to demand • Subsidized ethanol demand on top of robust food demand
Feed Outlook – Ethanol Links • Ethanol production has reached a level where price rationing for feed use is happening • 3 major demand sources: • Feed • Exports • Food, Seed and Industrial • Ethanol is the only growing piece • Ethanol demand growth is not market-driven • Who will cut back to make room for ethanol? • Additional corn makes little price difference
Price Supply Demand, w/tax credit B Amount of Tax Credit Demand, no tax credit A RFS Quantity Demanded and Supplied Biofuels S/D with tax credit/RFS
Price Demand, Supply w/RFS & tax credit B Tax credit A Biofuel Value RFS Quantity Demanded and Supplied Feedstock S/D with tax credit/RFS
Ethanol Facts 20 gallon tank of E10 = 25 pound turkey or 7 five pound broilers. Universal E85 in the U.S. = global grain supply Mandated 2008 U.S. ethanol = Australia + Indonesia grain crops Current and planned Iowa ethanol plants = Iowa importing corn
Ethanol cost/revenue drivers • Inputs as % of revenue • Corn 60-65% • Natural gas 14-15% • Chemicals 4% • All other costs 11% • Leaves about 8% for ROI and debt service • Revenue • 80-87% ethanol • 12-19% DDGS • <1% CO2
Boom Stops Boom Starts http://www.econ.iastate.edu/outreach/agriculture/periodicals/ifo/documents/IFO100107_000.pdf
Reality check – 2-20-2008 • DTN model ethanol plant, “Neeley Biofuels”, South Dakota • U.S. average ethanol price = $2.32/gal • NY regular gasoline = $2.58/gal • Corn at DTN model plant = $4.80 • Model plant profit = 18.7¢/gal http://www.dtnethanolcenter.com/index.cfm
18 cent plant profit, 2-20-2008 $4.80 $2.58 $2.32
Summary:We cannot produce enough corn to depress the price significantly below the level set by the value of corn to ethanol producers. If corn prices drop, ethanol producers will expand until the corn price increases enough to make further expansion unprofitable.
Ethanol Projections • Ethanol demand limited in short run by distribution and blending capacity • Long run limitation is feedstock (corn) supply • Demand is almost unlimited in the long run • E85 could use 500+ million acres of corn • Crude oil price and ethanol subsidy level will set long term corn prices • Use of cellulose also has many issues and limitations
Ethanol Refinery Rated Capacity http://www.ethanolrfa.org/industry/statistics/
CY Ethanol Rated Capacity/Production http://www.ethanolrfa.org/industry/statistics/
2008/2009 Ethanol Effects • Increased corn acreage has already doubled soybean meal prices • 2008 battle for acres • Corn acres need to increase • Soybean prices may prevent that • Further effects on global grain/oilseed prices • Food riots in China and Asia – already • China banned further use of grain for ethanol • EU and Canada withdrawing support for biofuels • Increasing use of DDGS in U.S. feeds
Corn Outlook – 2008/2009 • Potential ethanol demand for corn • About 3.33 billion bushels in CY 2008 • Going to be 4+ billion in CY 2009 • 2008 corn acres likely to decrease • Historic collision of ethanol and food is coming, and sooner rather than later • Mandated use creates price insensitivity • 2008/09 corn price could go to $6-8/bushel • How much acreage goes to beans + weather? • 2008 crop failure could take corn to over $10
Corn/Meal Price Outlook – 2008/2009 • Corn prices remain at $4.25-$5.00, meal at $325-375, through May-June • Weather drives prices after that • 2009 price outlook is “higher” • Biofuel production will increase • We are out of unused productive acres • There are limits to what biofuel producers can pay unless mandate becomes effective • Food prices will become a national issue
Corn Outlook – 2007/2008* * September 1 Crop Year