Download
1 / 46
460 likes | 618 Views
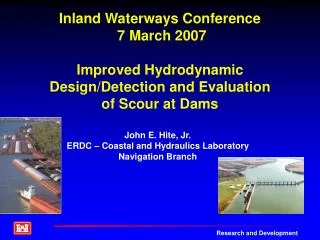
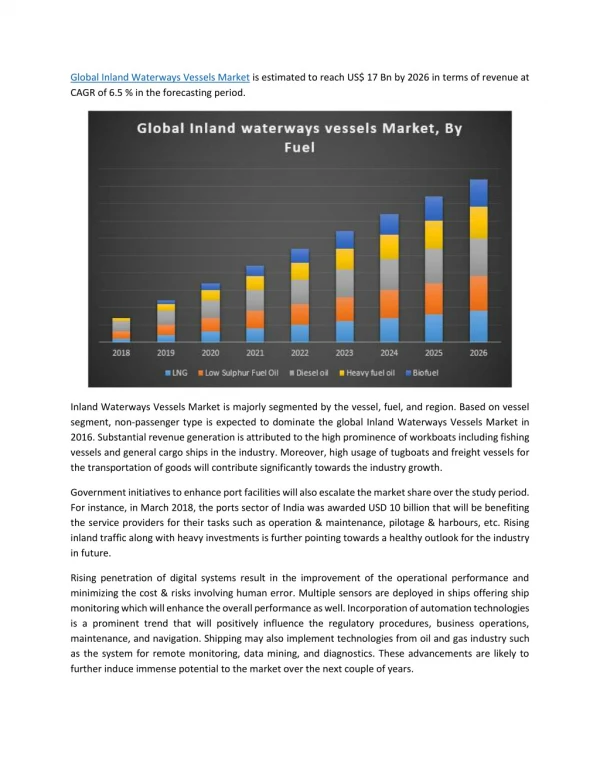
Emerging Opportunities for Our Inland Waterways Alabama Water Resources Association September 5-7, 2007. Ports and Waterways represented by CAWA Members. Alabama State Port Authority Alabama River Apalachicola-Chattahoochee-Flint Tennessee River Tennessee-Tombigbee Warrior-Tombigbee.

E N D
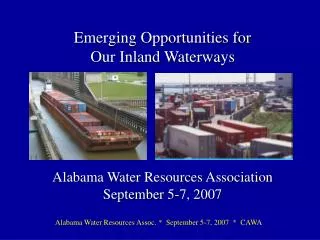
Emerging Opportunities for Our Inland Waterways Alabama Water Resources AssociationSeptember 5-7, 2007
Ports and Waterways represented by CAWA Members • Alabama State Port Authority • Alabama River • Apalachicola-Chattahoochee-Flint • Tennessee River • Tennessee-Tombigbee • Warrior-Tombigbee
Outline • Global Perspectives • Coastal Port Perspectives • Inland Waterway Opportunities • Alabama Freight Mobility Study • Opportunities for Alabama
Global Trade • Projections • international trade to double by 2020 • Container traffic to triple by 2020 • Latin American trade through Gulf to triple (or more) by 2020 • US Maritime Trade: $1 trillion of domestic and international freight
U.S. Maritime Container Trade GrowthCurrent 1,776 Seattle 1,798 4,478 Tacoma NY/NJ 1,809 Virginia 2,043 Oakland 1,860 Charleston 13,101 1,662 LA/LB Savannah 1,437 TEUs in thousands 1,010 Houston Miami 2004 Source: USDOT (Forecast figures based on 6 year linear regression)
U.S. Maritime Container Trade GrowthCurrent and Future Seattle 1,776 2,557 59,420 15,835 4,396 1,798 NY/NJ 4,478 Tacoma 5,566 1,809 Virginia 3,382 2,043 6,639 Oakland Charleston 1,860 9,420 13,101 1,662 LA/LB 6,165 Savannah TEUs in thousands 1,437 2,152 1,010 Houston Miami 2004 Source: USDOT (Forecast figures based on 6 year linear regression) 2020
Ports of Mobile and New Orleans are rapidly expanding container capabilities
The proposed Panama Canal Expansion will improve shipping opportunities between Far East & Gulf ________________________________________________________________________________________________________________________________________________ • Deepening/widening Atlantic entrance channel • New approach for Atlantic Post-Panamax locks • Atlantic Post-Panamax locks existing 110 x 1000 x 41.2 ft; new 180 x 1400 x 60 ft • Raise max Gatun Lake operating water level • Widening and deepening of the navigational channel of the Gatun Lake and the Culebra Cut • New approach channel for Post-Panamax locks • Pacific Post-Panamax locks with 3 water saving basins per lock chamber • Deepening and widening of the Pacific entrance channel
Credibility for Gulf Coast Container Ports at Mobile & New Orleans • Growth in global trade & congestion at ports • Mobile & New Orleans have expansion plans • Expanded Panama Canal
What moves by inland river barge? Today – heavy, bulky, oversize Future – higher valued goods
Alabama Freight Mobility Study • Funded by US DOT Policy & Research • Action plan for integrating inland waterways into freight transportation network • Developments along I-65 corridor: autos, steel, container terminal at Mobile, others
When the Mobile Container Terminal looks like this • We could be looking at scenes on I-10 and I-65 like these
AFMS Phase 1 Business Perspectives: Container-on-Barge Understanding global container business. Identifying decision makers and opportunities. Appendix A - Gen Purpose Terminal Inventory Appendix B - Furniture Case Study Appendix C - Waterway/Highway O&M Cost Comparison Appendix D - Montgomery Case Study
There are Two Primary Audiences or Users of the AFMS Information with Very Different Interests • Public Sector (Policy Makers) • Private Sector (Shippers, Carriers, Ports)
Government Policy Maker Interests • relieve congestion • conserve energy • highway capacity & maintenance
Private Sector Interests Shipper = reduce costs, improve reliability Carrier = ROI Ports = increase business, economic development
To make COB a reality, must provide real cost savings and returns to private sector To gain government support, must demonstrate benefits to society and environment
AFMS – Phase 1 To obtain a copy of the AFMS Phase 1 Report from Hanson Professional Services go to www.hanson-inc.com Click on “project reports”
AFMS – Phase 2 • Strategic Market Assessment from Columbus, MS to Chattanooga, TN • Understanding Mobile Container Terminal Operations from Inland River Perspective • Barge Industry Perspectives: COB • Understanding River Systems Using COB
Currently Operating COB Services Rhone-Saone River via Marseille/Fos • Characteristics • 49 hours and approximately 290 miles from end to end • 10 to 15% cheaper than over the road, • A dependable, regular and reliable service • Capacity of 264 teus carried per trip and 1320 teus per week • Ports Served • Marseille / Fos • Lyon • Macon • Chalon sur Saone
Shipper Priorities *Based on survey of 1000 multinational shippers
Virginia Inland Terminal Example • Front Royal, VA is the site of a rail terminal designed to expedite containers from the Virginia coastal ports to an off-site location where they can be picked up by industry. • Has attracted warehousing and distribution centers to the Front Royal area. • Importers and exporters alike benefit from this facility due to not having to travel to typically congested port facilities on the coast. • Daily rail service to and from the inland terminal and the marine port facility increases efficiency of the operation.
Currently Operating COB Services Columbia/Snake River via Port of Portland • Characteristics • 47 hours and 360 Miles end to end • Ports served • Boardman • Umatilla • Pasco • Lewiston
One opportunity to reduce truck traffic? Furniture Companies in Mississippi, Alabama, and Tennessee
Closing • Global trade is growing • Traffic congestion is increasing • Waterways can help reduce congestion and enhance competitiveness of US economy • Waterway transportation is more energy efficient and environmentally friendly than truck or rail • Making best use of use of all modes is the key