Current Drinking Among Adolescents
100 likes | 224 Views
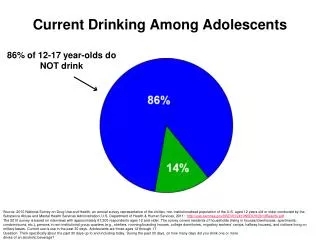
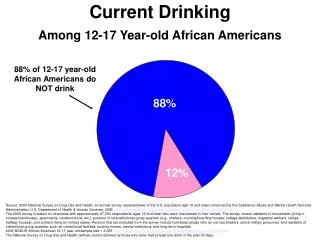
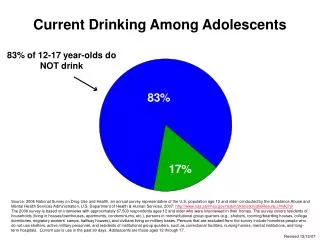
In a 2006 National Survey on Drug Use and Health, it was reported that 83% of adolescents aged 12-17 do not consume alcohol. Additionally, only 72% of individuals aged 12-20 are not current drinkers, showcasing a significant decline in alcohol use among youth. The survey involved approximately 67,500 respondents and emphasizes that current drinking refers to consuming alcohol in the past 30 days. This trend highlights changing attitudes toward alcohol consumption among younger populations in the U.S., as noted in various studies over the years.

Current Drinking Among Adolescents
E N D
Presentation Transcript
Current Drinking Among Adolescents 83% of 12-17 year-olds do NOT drink Source: 2006 National Survey on Drug Use and Health, an annual survey representative of the U.S. population age 12 and older conducted by the Substance Abuse and Mental Health Services Administration, U.S. Department of Health & Human Services, 2007: http://www.oas.samhsa.gov/nsduh/2k6nsduh/2k6Results.cfm#Ch3 The 2006 survey is based on interviews with approximately 67,500 respondents ages 12 and older who were interviewed in their homes. The survey covers residents of households (living in houses/townhouses, apartments, condominiums, etc.), persons in noninstitutional group quarters (e.g., shelters, rooming/boarding houses, college dormitories, migratory workers‘ camps, halfway houses), and civilians living on military bases. Persons that are excluded from the survey include homeless people who do not use shelters, active military personnel, and residents of institutional group quarters, such as correctional facilities, nursing homes, mental institutions, and long-term hospitals. Current use is use in the past 30 days. Adolescents are those ages 12 through 17. Revised 12/12/07
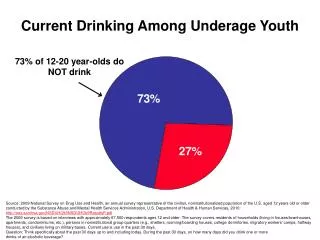
Current Drinking Among Underage Youth 72% of 12-20 year-olds do NOT drink Source: 2006 National Survey on Drug Use and Health, an annual survey representative of the U.S. population age 12 and older conducted by the Substance Abuse and Mental Health Services Administration, U.S. Department of Health & Human Services, 2007: http://www.oas.samhsa.gov/nsduh/2k6nsduh/2k6Results.cfm#Ch3 The 2006 survey is based on interviews with approximately 67,500 respondents ages 12 and older who were interviewed in their homes. The survey covers residents of households (living in houses/townhouses, apartments, condominiums, etc.), persons in noninstitutional group quarters (e.g., shelters, rooming/boarding houses, college dormitories, migratory workers‘ camps, halfway houses), and civilians living on military bases. Persons that are excluded from the survey include homeless people who do not use shelters, active military personnel, and residents of institutional group quarters, such as correctional facilities, nursing homes, mental institutions, and long-term hospitals. Current use is use in the past 30 days. Revised 12/12/07
Alcohol Use Among 8th Graders Percent Who Drank In The Past 30 Days 29 percent lower in 2007 than in 2000 37 percent lower in 2007 than in 1991 Lowest level since tracking began 1991 Source: The University of Michigan Monitoring the Future Study, sponsored by the National Institute on Drug Abuse, U.S. Department of Health & Human Services. Surveys of nationally representative samples of American high school seniors were begun in 1975, making the class of 2007 the 33rd such class surveyed. Surveys of 8th and 10th graders were added to the design in 1991, making the 2007 nationally representative samples the 17th such classes surveyed. The sample sizes in 2007 are 16,495 eighth graders in 151 schools, 16,398 tenth graders in 120 schools, and 15,132 twelfth graders in 132 schools, for a total of 48,025 students in 403 secondary schools. The samples are drawn separately at each grade level to be representative of students in that grade in public and private secondary schools across the coterminous United States. Schools are selected with probability proportionate to their estimated class size. The findings are located at http://www.monitoringthefuture.org. Accessed 12/11/2007. Question wording: “On how many occasions (if any) have you had alcohol to drink– more than just a few sips during the last 30 days?” (0 Occasions, 1-2 Occasions, 3-5 Occasions, 6-9 Occasions, 10-19 Occasions, 20-39 Occasions, 40 or More) Revised 12/12/07
Alcohol Use Among 10th Graders Percent Who Drank In The Past 30 Days 19 percent lower in 2007 than in 2000 22 percent lower in 2007 than in 1991 Source: The University of Michigan Monitoring the Future Study, sponsored by the National Institute on Drug Abuse, U.S. Department of Health & Human Services. Surveys of nationally representative samples of American high school seniors were begun in 1975, making the class of 2007 the 33rd such class surveyed. Surveys of 8th and 10th graders were added to the design in 1991, making the 2007 nationally representative samples the 17th such classes surveyed. The sample sizes in 2007 are 16,495 eighth graders in 151 schools, 16,398 tenth graders in 120 schools, and 15,132 twelfth graders in 132 schools, for a total of 48,025 students in 403 secondary schools. The samples are drawn separately at each grade level to be representative of students in that grade in public and private secondary schools across the coterminous United States. Schools are selected with probability proportionate to their estimated class size. The findings are located at http://www.monitoringthefuture.org. Accessed 12/11/2007. Question wording: “On how many occasions (if any) have you had alcohol to drink– more than just a few sips during the last 30 days?” (0 Occasions, 1-2 Occasions, 3-5 Occasions, 6-9 Occasions, 10-19 Occasions, 20-39 Occasions, 40 or More) Revised 12/12/07
Drinking Among High School SeniorsPercent Who Have Consumed Alcohol in the Last Month 11 percent lower in 2007 than in 2000 36 percent lower in 2007 than in 1982 Lowest level since tracking began in 1975 Source: The University of Michigan Monitoring the Future Study, sponsored by the National Institute on Drug Abuse, U.S. Department of Health & Human Services. Surveys of nationally representative samples of American high school seniors were begun in 1975, making the class of 2007 the 33rd such class surveyed. Surveys of 8th and 10th graders were added to the design in 1991, making the 2007 nationally representative samples the 17th such classes surveyed. The sample sizes in 2007 are 16,495 eighth graders in 151 schools, 16,398 tenth graders in 120 schools, and 15,132 twelfth graders in 132 schools, for a total of 48,025 students in 403 secondary schools. The samples are drawn separately at each grade level to be representative of students in that grade in public and private secondary schools across the coterminous United States. Schools are selected with probability proportionate to their estimated class size. The findings are located at http://www.monitoringthefuture.org. Accessed 12/11/2007. Question wording: “On how many occasions (if any) have you had alcohol to drink– more than just a few sips during the last 30 days?” (0 Occasions, 1-2 Occasions, 3-5 Occasions, 6-9 Occasions, 10-19 Occasions, 20-39 Occasions, 40 or More) Revised 12/12/07
Percentage of College Freshmen Who Drink Beer Frequently or Occasionally 12 percent lower in 2006 than in 2000 43 percent lower in 2006 than in 1982 Lowest level since tracking began in 1966 Source: The American Freshman Survey, sponsored by UCLA and the American Council on Education and conducted by the Higher Education Research Institute at UCLA’s Graduate School of Education & Information Studies. Now in its 41st year, the UCLA survey is the nation’s longest running and most comprehensive assessment of student attitudes and plans. The 2006 freshman norms are based on the responses of 271,441 first-time, full-time students at 393 of the nation’s baccalaureate colleges and universities. The data have been statistically adjusted to reflect the responses of the 1.3 million first-time, full-time students entering four-year colleges and universities as freshmen in 2006. Respondents self-reported whether they engaged in a list of activities (including “drank beer”) frequently, occasionally, or not at all in the past year. http://www.gseis.ucla.edu/heri/norms06.php Revised 12/12/07
Percentage of High School Students Who Had Their First Drink of Alcohol Before Age 13* 22% Decline Since 1991 Lowest level since tracking began in 1991 Source: Youth Risk Behavior Survey (YRBS), Centers for Disease Control and Prevention. The YRBS is an in-school survey of students in grades 9 through 12. Students completed self-administered questionnaires in their classrooms. In 2005, the national sample consisted of 13,917 responses from 159 schools. In 1991, the national sample consisted of 12,272 responses from 137 schools. http://apps.nccd.cdc.gov/yrbss/QuestYearTable.asp?path=byHT&ByVar=CI&cat=3&quest=Q40&year=2005&loc=XX * Other than a few sips 1 Significant linear decrease, p < .05 Revised 12/12/07
Total Fatalities in Drunk-Driving Crashes 36 percent lower in 2006 than in 1982 Source: National Highway Traffic Safety Administration, U.S. Department of Transportation. Drunk-driving fatalities represent the total number of people (occupants and nonoccupants) killed in motor vehicle traffic crashes in which at least one driver/motorcycle operator had a BAC of .08 or higher. Revised 12/12/07
Total Drunk-Driving Fatalities Per Billion Vehicle Miles Traveled 7 percent lower in 2006 than in 2000 66 percent lower in 2006 than in 1982 Source: U.S. Department of Transportation, National Highway Traffic Safety Administration. Federal Highway Administration Annual Highway Statistics; Drunk-driving fatalities represent the total number of people (occupants and nonoccupants) killed in motor vehicle traffic crashes in which at least one driver had a BAC of .08 or higher. http://www.nhtsa.dot.gov/portal/nhtsa_static_file_downloader.jsp?file=/staticfiles/DOT/NHTSA/NCSA/Content/PDF/810837.pdf, http://www.fhwa.dot.gov/ohim/tvtw/07juntvt/index.htm, http://www.fhwa.dot.gov/policy/ohpi/qfvehicles.htm, http://www-nrd.nhtsa.dot.gov/Pubs/TSF2005.PDF Revised 12/12/07
Total Fatalities in Teen Drunk-Driving Crashes 10 percent lower in 2006 than in 2000 63 percent lower in 2006 than in 1982 Source: National Highway Traffic Safety Administration, U.S. Department of Transportation. Teen drunk-driving crashes represent the total number of people (occupants and nonoccupants) killed in motor vehicle traffic crashes in which at least one teenage (16-20) driver had a BAC of .08 or higher. Revised 12/12/07