Download

1 / 9
90 likes | 190 Views
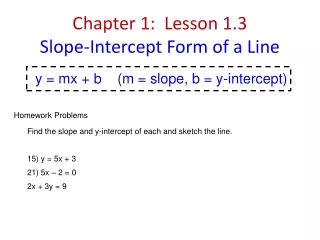
SLOPE INTERCEPT FORM OF A LINE. y = mx + b. The equation is called the slope intercept form for a line. The graph of this equation is a straight line. The slope of the line is m. The line crosses the y-axis at b . The point where the line crosses the y-axis is called the y-intercept.

E N D
SLOPE INTERCEPT FORM OF A LINE
y = mx + b • The equation is called the slope intercept form for a line. • The graph of this equation is a straight line. • The slope of the line is m. • The line crosses the y-axis at b. • The point where the line crosses the y-axis is called the y-intercept. • The (x,y) coordinates for the y-intercept are (0,b)
Y = mx+ b • If your slope is positive the line will go up hill. • If your slope is negative the line will go down hill. • Remember we read from left to right. • Also, the slope is the m value. • Slope is RISE over RUN written as a fraction. • If the m is a whole number put it over one to form a fraction.
Types of lines • 1. All lines are straight. • 2. They can be horizontal, vertical, or diagonal.
Graphing lines using the equation • Identify the Y-intercept (b) and graph it on the y-axis with a point. • Identify what the slope is (m). Remember slope is rise over run. • From the point on the y-axis, if your slope is positive go up or if it is negative go down whatever the RISE is. Go over to the right for the run. Mark the spot with a point. • Draw a line thru those two points
Y= 2/3 x + 3 • Go to the y-axis and draw a point at 3. • From that point go up 2 units and over 3 units. Draw a point. • Draw a line thru those two points. • That is how easy it is to graph lines.
Y = -3x -1 • Go to the y-axis and draw a point at –1. • From that point go down 3 units and over 1. Draw a point. • Draw a line thru those points. • Wow that was easy!
Y= 2 • Draw out a two column box. The first column is labeled X and the second column is labeled Y. • Fill the Y column with values of 2 because the equation said so. • Pick any values for x. • Now graph those ordered pairs and draw a line thru those points.
X= -4 • Make a chart again like last time. • But, All the values for x are –4’s. Because our equation said so. • You decide the values for the y’s. • Now graph the ordered pairs and draw a line thru those points.