Download
1 / 14
140 likes | 416 Views
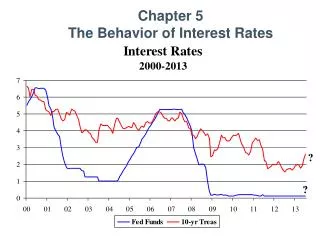
Chapter 5 The Behavior of Interest Rates. ?. ?. Interest rate are low today because of: QE-4, Fed buying $30 b of MBS and $35 b of Treasury bonds each month. Eurozone debt crisis Corporate sector excess cash Financial institutions’ large surplus funds

E N D
Interest rate are low today because of: • QE-4, Fed buying $30 b of MBS and $35 b of Treasury bonds each month. • Eurozone debt crisis • Corporate sector excess cash • Financial institutions’ large surplus funds Investors will adjust their portfolios in expectation of when the Fed will tighten monetary policy. • Fed is reducing its of bond buying and could exit QE by the end of 2013 if economic growth accelerates. This will increase Treasury yields and reduce bond prices. So investor demand for longer-term bonds will decline, pushing up interest rates. • Markets expect Fed to end ZIRP in first quarter of 2015. Fed will raise fed funds rate when the unemployment rate falls below 6.5% and 2-year inflation expectations rise above 2.5%. • Banks are decreasing interest rate risk by investing short term.
The Big QuestionDoes a MS => i ? Effects of MS on i 1. Liquidity Effect Ms, Ms shifts right, i 2. Income Effect Ms, Income , Md, Md, i 3. Price Level Effect Ms, Permanent Price level , Md, Md, i 4. Expected Inflation Effect Ms => Fe => Bd &Bs (Fisher effect) => i Answer: Effect of higher DM/M on i is ambiguous If assume Ceteris Paribus
Derivation of Bond Demand Curve Assume • 1-Yr discount bond (no coupon payments) • Pays $1,000 face value in one year • Holding period = 1 year , then return = i = YTM i = RetE = (F – P)/P For each P, there is a corresponding i If P = $950, then i = (1,000 - $950)/950 = 0.053 Assume QD = $100 billion If P = $750, then i = (1,000 - $750)/750 = 0.333 Assume QD = $500 Law of Demand (lower price => higher QD) (higher return => higher QD)
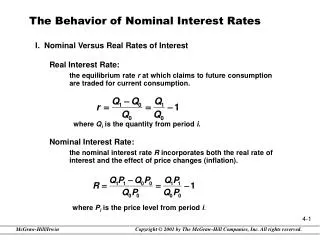
Determinants of Asset Demand QD = f(P/i; Wealth, RE, Risk, Liquidity) + + - + • Wealth = total resources owned Y => W => DB MPS => W => DB • RE = C/P + (PEt+1- Pt)/Pt iEt+1 => PEt+1 => RE => DB FE => relative RE => DB relative to other assets • Risk = degree of return uncertainty relative to other assets • Liquidity = ease and speed of turning asset into cash relative to other assets
Factors That Lower Long-Term Interest Rates by Increasing the Demand for Bonds Wealth: Economic Expansion => Increasing wealth => increased demand for bonds => Pbonds increases => rbonds decreases Expected Interest Rates: Lower expected interest rates in the future => raise the expected return of long-term bonds => increased demand for bonds => Pbonds increases => rbonds decreases Stock Market: Lower expected stock prices in the future => expected return on bonds relative to stocks would rise => increased demand for bonds => Pbonds increases => rbonds decreases Expected Inflation: Falling expected rate of inflation => raises the expected return on bonds relative to the expected return on real assets => increased demand for bonds => Pbonds increases => rbonds decreases Risk: Increase in riskiness of alternative assets => increased demand for bonds => Pbonds increases => rbonds decreases Liquidity: Decreased liquidity of alternative assets => increased demand for bonds => Pbonds increases => rbonds decreases
Bond Supply Curve Relationship between QS and P As P , i => less costly for firms to borrow => borrowing => QS QS = f(P/i; PI, FE, Def.) +/- + + + • PI = Profitability of investment opportunities AD => P => P = PY – Costs => I => Y • FE = Expected inflation (return on real assets) r = i - FE • Def. = Government Deficits
Econ 330 Homework 3Due Friday, February 14 Chapter 5 Questions & Applied Problems: 14, 18, 19, 20, 23, 24, 25