Download
1 / 39
390 likes | 620 Views
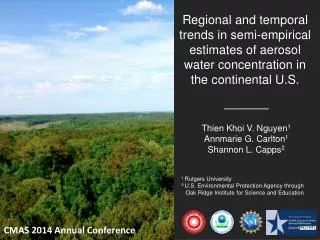
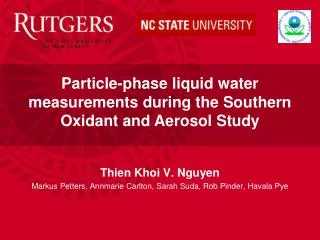
Particle-phase liquid water measurements during the Southern Oxidant and Aerosol Study. Thien Khoi V. Nguyen Markus Petters , Annmarie Carlton, Sarah Suda , Rob Pinder , Havala Pye. Introduction.

E N D
Particle-phase liquid water measurements during the Southern Oxidant and Aerosol Study Thien Khoi V. Nguyen Markus Petters, Annmarie Carlton, Sarah Suda, Rob Pinder, HavalaPye
Introduction Dry constituent: low-volatility species that remain predominantly in the particle phase (e.g. sulfates, elemental carbon, organic compounds) Semi-volatile compounds (SV): partition between the condensed and gaseous phases (e.g. glutaric acid, pyruvic acid, oxalic acid) Water: condenses onto existing aerosol particles as f(RH, T, aerosol and gas phase chemical composition) Vamb = Vdry +Vsv+ Vw SV Sample atmospheric aerosol particle Dry Water
Particle-phase liquid water • What are the trends in particle-phase liquid water content? • Why is aerosol water important? • Atmospheric aqueous chemistry: medium for partitioning of polar, water-soluble-gas phase species • Visibility impairment: affects aerosol light scattering, extinction coefficients, and aerosol optical depths • Influences climate: affects cloud forming properties and acid deposition • Improve atmospheric photochemical models (e.g., CMAQ)
WhySOAS? • Southern Oxidant and Aerosol Study (SOAS) • June 1 to July 15, 2013 • Talladega National Forest in Brent, AL • Liquid water is predicted to be the dominant aerosol constituent in the Eastern US(Carlton and Turpin, 2013) Particle Phase Liquid Water Particle Phase Organic Mass 10 5 µg m-3 0 H2Optcl calculated in CMAQ using ISORROPIA July 2003 average, CMAQv4.7 Adapted from Carlton and Turpin, 2013; simulation details in Carlton et al., 2010
Study Goals Semi-volatile Differential Mobility Analyzer (SVDMA): Test the hypothesis that water is the dominant aerosol constituent in the SE U.S. • Instrument deployed during SOAS campaign • Collect 6 weeks of continuous in situ data • Identify chemical and thermodynamic controls on particle phase liquid water content • Validate model predictions of particle phase liquid water content Aerial view of SOAS AL ground site
SVDMA 1. Ambient Tambient Tinlet= Tambient Vdry To SMPS RH sheath = RH ambient Vsv Vw 2. Dry Tinlet= Tambient – 30C Tambient To SMPS RH sheath ~ 10% Vdry 3. Dry-humidified Tambient Tinlet= Tambient – 30C sample re-humidification Vdry Vw To SMPS RH sheath = RH ambient Vw= Vdryhumidifed– Vdry Vsv = Vambient– Vdryhumidifed Size range: ~10-1000 nm
SVDMA during SOAS Nafion tubes HVPS Thermoelectric cooler T bath CPC 2 DMA Inlet LabView CPC 1 Dryer
Bimodal distribution • Two modes in volume distribution: lower diameter mode (D1) and higher diameter mode (D2) • Lognormal fittings: Fit volume data to lognormal distribution to obtain mean diameter for each mode to use later on for analysis Ambient Dry-humidified Dry D2 D2 D2 D1 D1 D1
Hygroscopicity Parameter, κ κ: hygroscopicityparameter that describes water uptake κ = 0 means no water uptake (nonhygroscopic compounds) κ ~ 0.01 to 0.5 for slightly to very hygroscopic species κ ~ 0.5 to 1.4 for highly hygroscopic compounds κ = ∑Eiκi κorg~ 0.1 κSO4 ~ 0.5 κNO3~ 0.7 2 Diameter Modes • aw: water activity • Ddh: mode diameter, dry-humidified state • Ddry: mode diameter, drystate • Vw: particle phase liquid water • Vdry: dry aerosol volume Volume-based κ Diameter-based κ Equations adapted from Petters and Kreidenweis, 2007
κ Diurnal Trend Lower diameter mode κ ~ 0.1 to 0.2 Smaller diameter mode may be more organic dominated (lower κ). Higher diameter mode κ ~ 0.2 to 0.3 Higher diameter mode may contain more sulfates (higher κ) & comprises most of the volume Volume κ ~ 0.2 to 0.3 Consistent with a mix of organic and inorganic compounds
Growth factor (volume-based) gfvol= 1 (no volume change when water condenses onto particle) gfvol= 2 (volume doubles when water condenses onto particle)
Semi-volatiles 95% Confidence Interval: Detection of SV material is not statistically discernible Water-mediated partitioning of SV • Reversible process on short time scales • OR • Effect is smaller than our measurement uncertainty
CMAQ comparison CMAQ SVDMA Base comparison: SVDMA parameters (Vdry and RH) adjusted to CMAQ’s parameters Liquid water (µg m-3) Hours past midnight (local time) • CMAQv5.0.1
Conclusions • Diurnal cycle in water content • Liquid water is the dominant aerosol constituent (GFvol > 2) during morning hours (7-9 AM) when RH is decreasing • Changes in aerosol composition in terms of water uptake and lossoccur on short time scales • κ ~ 0.1 to 0.2 for lower diameter mode, suggesting the presence of more organics than sulfates. κ ~ 0.2 to 0.3 for higher diameter mode (more sulfates) and volume-based calculations. • Detection of SV material is not statistically discernible • Base comparison shows similar trends between CMAQ and SVDMA water data, but there are offsets in κ comparison
Acknowledgements • National Science Foundation • EPA, NOAA, ARA, NCAR, EPRI • U.S. Department of Education • Lab group at Rutgers • All of the SOAS participants • CMAQ developers • Everyone here for attending
Particle-phase liquid water • How do anthropogenic influences on particle water affect partitioning of organic gases to the condensed phase and biogenic SOA formation? • Visibility impairment: affects aerosol light scattering, extinction coefficients, and aerosol optical depths • Poor summertime visibility in eastern U.S. primarily due to high [SO4] exposed to high RH. (Malm et al., 1994; Park et al., 2004; Pitchford et al., 2007) • Influences climate: affects cloud forming properties and acid deposition • Improve atmospheric photochemical models (e.g., CMAQ) to enable more effective strategies of air quality management and climate mitigation. Shenandoah National Park, img: NPS
Most places liquid water is more accessible than OM dry aerosol mass sulfate/nitrate/ammonium/ organic+elemental carbon water aerosol mass associated sulfate/nitrate/ammonium/ organic+elemental carbon mg m-2 Aerosol water is 2-3 times dry aerosol mass. Liao and Seinfeld JGR (2005)
Introduction Anthropogenic pollution enhances biogenic secondary organic aerosol (SOA) formation. SVOC1 SVOC2 SVOCn VOC Condensation Oxidant (O3, OH, NO3,…) + SOA (equilibrium partitioning) (isoprene, monoterpenes, SESQ) … “Like” dissolves into “like”: non polar semi-volatile compounds will partition to OA (e.g. dry) matrix, polar organic gases will partition to polar solvents (e.g. water) Absorptivepartitioningframework(Pankow, 1994; Odum et al., 1996; Donahue et al., 2006)
Water mass Dry mass NOx, primary OA emissions are anthropogenic influences on BSOA formation (Carlton et al., 2010; Hoyle et al., 2010; Shilling et al., 2013). SO2 pollution, through contributions to aerosol water likely influences BSOA as well. Average SOA in SE U.S. 2-3 µg m-3(Carlton et al., 2010b) mg m-2 Amazon OA < 1µg m-3(Pöschl et al., 2010; Martin et al, 2010) Liao and Seinfeld (2005) Note: wet scavenging unconstrained
Semi-volatile Differential Mobility Analyzer (SVDMA) • Use T and RH controlled DMA • Scanning mobility particle sizing (SMPS) mode with CPC 13 to 1067 nm • 0.5 hr time resolution • Operates/traces ambient conditions (5C < T < 40C) • Temperature-controlled cooled inlet freezes out water and semi-volatile organic compounds • 3 inlet states temperature control loop
Loss of semi-volatiles Tinlet= Tambient – 30C • Cooling reduces saturation vapor pressure by ~ 2 orders of magnitude • Reduced vapor pressures lead to condensation of vapor onto the inlet surface • Reheating the sample reduces the relative saturation ratio, driving off water and semi-volatile organic compounds from the aerosol • Water fully equilibrates as expected by thermodynamics Tambient – 30C
Vw = Vdry-humidified – Vdry • Vsv = Vambient – Vdry-humidified Semi-volatile Differential Mobility Analyzer (SVDMA) Vdry • Dry • Ambient • Dry-humidified Figure by S.R. Suda Vdry Vdry Diameter range: ~10 to 1000 nm Vsv Vw Vw
Example snapshot of data Total particle volume (µm3 cm-3) 80 60 40 20 0 0 15 10 5 hour (local) Total particle concentration measured by CPC (# cm-3) Unperturbed QA check CPC Dry QC check flagged Dry-Wet 6e3 4e3 2e3 0 0 15 10 5 hour (local)
SVDMA during SOAS Isothermal Instrument Tornado Shelter Trace ambient temperature: “outdoor inlet” T, RH-controlled DMA column
CMAQ Community MultiscaleAir Quality (CMAQ) Model • 3-dimensional photochemical air quality model • U.S. EPA uses CMAQ for regulatory applications • NOAA uses CMAQ for air quality forecasts • Tropospheric O3, particles, toxics, acid deposition • One atmosphere and multi-scale urban, regional, hemispheric • Well-vetted: open source, user community is large and dispersed img: climatescience.gov
CMAQ CMAQ Details • CMAQ version 5.0.1 • Expanded SAPRC07 gas-phase isoprene chemistry (Xie et al. 2013 ACP, Lin et al. 2013 PNAS) and updated isoprene aerosol (Pye et al. 2013 ES&T) • Anthropogenic emissions: NEI 2008 adjusted to 2013 levels • Biogenic emissions: calculated inline using BEIS • Met data from WRF version 3.4 converted to CMAQ inputs using MCIP version 4.1.3
CMAQ CMAQ Details • CUMULUS PARAMETERIZATION: Kain-Fritsch (new Eta) • SHALLOW CONVECTION: No shallow convection • MICROPHYSICS: Morrison 2-moment • LONGWAVE RADIATION: RRTMg • SHORTWAVE RADIATION: RRTMg • PBL SCHEME: ACM2 (Pleim) • SURFACE LAYER SCHEME: Pleim • LAND-SURFACE SCHEME: Pleim-Xiu • Land-Surface Model • URBAN MODEL: No urban physics • LAND USE CLASSIFICATION: NLCD50 • 3D ANALYSIS NUDGING: GRID
Lognormal Distribution Fitting Bimodal fitting: based on Seinfeld & Pandis, 2006, equation 8.34 • Non-linear least squares model fitting in R to optimize: • Vt, Dpg1, Dpg2, σg1, σg2
Quicklook sample Dry Volume (~5 m3 cm-3) Dry-Wet (~7.5 m3 cm-3) (~7.5 m3 m-3) Do Nothing (~7.5 m3cm-3) V(µm3cm-3) • Dry Mass: dry • Wet Mass: dry-wet – dry • Semi-volatile Mass: do • nothing – dry-wet Total particle concentration measured by CPC Dry-Wet Do Nothing Dry
Summary Plot For dry spectra, 18% of the volume is found in the smaller Dp mode. For dry-wet spectra, 13% of the volume is found in the smaller Dp mode water uptake increases Dp
CMAQ comparison y=x CMAQ SVDMA