Comparative Analysis of YBCO and Zr-Doped Samples with BZO for High Field Applications
80 likes | 206 Views
Investigating the performance differences between YBCO and Zr-doped samples in high magnetic fields through magneto-optical visualization and defect analysis. Examination of Jc(θ, B) angular dependencies compared to BZO-doped samples. Exploring the influence of defects on growth and performance.

Comparative Analysis of YBCO and Zr-Doped Samples with BZO for High Field Applications
E N D
Presentation Transcript
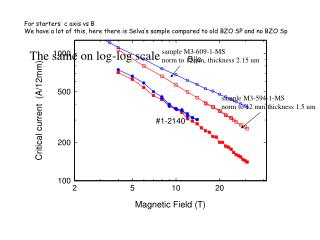
For starters c axis vs B We have a lot of this, here there is Selva’s sample compared to old BZO SP and no BZO Sp sample M3-609-1-MS norm to 12mm, thickness 2.15 um The same on log-log scale sample M3-594-1-MS norm to 12 mm thickness 1.5 um
SP26 SP27 (former 25) SP20
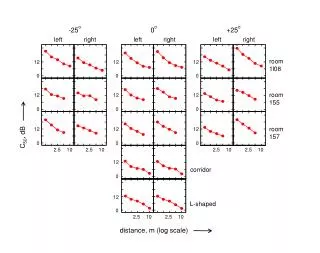
In contrast to 77 K , at T =4.2 K different YBCO CC have similar Jc(, B) No c-axis maximum Cusp-like ab maximum ab ab Narrow channel to reduce current below 500 A
For the above angular, maybe: 1 show that these with BZO wider That exp fits for high fields That GL fits for low fields-we have 1 T sometimes If what Alex said is true, anizotropy for 1 T for NO BZO should be lower than for BZO I did not checked yet… And maybe something about scaling, like starting from 1 T and vs B calculate how it departs from GL For higher fields
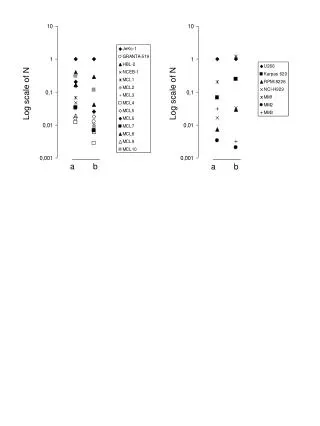
I very like this, but this is MetOx Same data, vertical scale log It seems that Zr samples have wider maxima than Y doped FWHM shown in the legend are larger for Zr doped, indeed
Is it good for paper? Would SP be happy? (there is a better version
RESULTS Magneto-optical visualization reveals defects All perfect defects perfect bad How macroscopic defects in substrate, coating copper etc etc influence growth, performance? Is there any correlation?
Figure as this??? SP26 should look better here ( ( ( ( ( ) ) ) ) / ) d h B B B I B T T T T A i 4 t m m w c Ic vs. field @ 0/60/70/80/85/90 deg: different tapes 90 90 90 90 85 85 85 85 80 80 80 80 70 70 70 60 70 60 60 60 0 deg 0 deg 0 deg 0 deg • At 20 deg off plane: upto 200 A at 30 T • BZO doped sample: the highest Ic at 5 deg off