Download

1 / 21
220 likes | 430 Views
Multimodal Information Analysis for Emotion Recognition. (Tele Health Care Application) Malika Meghjani Gregory Dudek and Frank P. Ferrie. Content. Our Goal Motivation Proposed Approach Results Conclusion. Our Goal. Automatic emotion recognition using audio-visual information analysis.

E N D
Multimodal Information Analysis for Emotion Recognition (Tele Health Care Application) Malika Meghjani Gregory Dudek and Frank P. Ferrie
Content • Our Goal • Motivation • Proposed Approach • Results • Conclusion
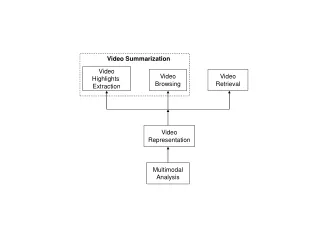
Our Goal • Automatic emotion recognition using audio-visual information analysis. • Create video summaries by automatically labeling the emotions in a video sequence.
Motivation • Map Emotional States of the Patient to Nursing Interventions. • Evaluate the role of Nursing Interventions for improvement in patient’s health. NURSING INTERVENTIONS
Proposed Approach Visual Feature Extraction Visual based Emotion Classification Recognized Emotional State Data Fusion Decision Level Fusion Audio Feature Extraction Audio based Emotion Classification Feature Level Fusion
Visual Analysis • Face Detection (Voila Jones Face Detector using Haar Wavelets and Boosting Algorithm) • Feature Extraction (Gabor Filter: 5 Spatial Frequencies and 4 orientations, 20 filter responses for each frame) • Feature Selection (Select the most discriminative features in all the emotional classes) • SVM Classification (Classification with probability estimates)
Visual Feature Extraction = X ( 5 Frequencies X 4 Orientation)Frequency Domain Filters Feature Selection Automatic Emotion Classification
Audio Analysis • Audio Pre-Processing (Remove leading and trailing edges) • Feature Extraction (Statistics of Pitch and Intensity contours and Mel Frequency Cepstral Coefficients) • Feature Normalization (Remove inter speaker variability) • SVM Classification (Classification with probability estimates)
Audio Feature Extraction Audio Feature Extraction Automatic Emotion Classification Speech Rate PitchIntensitySpectrum Analysis Mel Frequency Cepstral Coefficients(Short-term Power Spectrum of Sound) Audio Signal
Feature Selection • Feature selection method is similar to the SVM classification. (Wrapper Method) • Generates a separating plane by minimizing the weighted sum of distances of misclassified data points to two parallel planes. • Suppress as many components of the normal to the separating plane which provide consistent results for classification. Average Count of Error Features Distance Selected Bounding Planes
Data Fusion • Decision Level: • Obtaining probability estimate for each emotional class using SVM margins. • The probability estimates from two modalities are multiplied and re-normalized to the give final estimation of decision level emotional classification. 2. Feature Level: Concatenate the Audio and Visual feature and repeat feature selection and SVM classification process.
Database and Training Database: • Visual only posed database • Audio Visual posed database Training: • Audio segmentation based on minimum window required for feature extraction. • Corresponding visual key frame extraction in the segmented window. • Image based training and audio segment based training.
Time Series Plot Surprise Sad Angry Disgust Happy 75% Leave One Subject Out Cross Validation Results ( * Cohen Kanade Database, Posed Visual only Database)
Feature Level Fusion (*eNTERFACE 2005 , Posed Audio Visual Database)
Decision Level Fusion (*eNTERFACE 2005 , Posed Audio Visual Database)
Conclusion Combining two modalities (Audio and Visual) improves overall recognition rates by 11% with Decision Level Fusion and by 6% with Feature Level Fusion Emotions where vision wins: Disgust, Happy and Surprise. Emotions where audio wins: Anger and Sadness Fear was equally well recognized by the two modalities. Automated multimodal emotion recognition is clearly effective.
Things to do… • Inference based on temporal relation between instantaneous classifications. • Tests on natural audio-visual database (on-going).