Download
1 / 23
230 likes | 329 Views
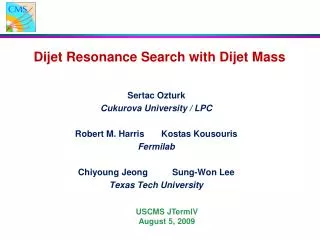
Dijet Ratio from QCD and Contact Interactions. Manoj Jha (Delhi) Robert Harris (Fermilab) Marek Zielinski (Rochester) 28 th June, 2007 LPC Physics Group Fermilab. Overview. Motivation Data Sample and Analysis QCD Background Contact Interaction Signal

E N D
Dijet Ratio from QCD and Contact Interactions Manoj Jha (Delhi) Robert Harris (Fermilab) Marek Zielinski (Rochester) 28th June, 2007 LPC Physics Group Fermilab
Overview • Motivation • Data Sample and Analysis • QCD Background • Contact Interaction Signal • Optimization of eta cuts within Barrel • Conclusion
QCD t - channel Search for Contact Interactions • New physics at a scale L above the observed dijet mass is effectively modelled as a contact interaction. • Quark compositeness. • New interactions from massive particles exchanged among partons. • Search for contact interactions using dijet ratio. • Simple measure of dijet angular distribution. Quark Compositeness New Interactions q q M ~ L M ~ L q q Dijet Mass << L Quark Contact Interaction q q L q q
Dijet Ratio: Simple Angular Measure h = -1 - 0.5 0.5 1 • Dijet Ratio = N(|h|<0.5) / N(0.5<|h|<1) • Number of events in which each leading jet has |h|<0.5, divided by the number in which each leading jet has 0.5<|h|<1.0 • Simplest measurement of angle dist. • Uses experimental variable h and avoids crossing crack boundaries. Barrel only, reduces systematics. • Uses same mass binning as dijet resonance search. • Measurement is almost automatic from ds/dm for |h|<1. • Just need to understand response variation with h in the barrel. • Search for both contact interactions and resonances. Jet 1 Numerator Sensitive to New Physics |cos q*| ~ 0 z Jet 2 Jet 1 Denominator Dominated By QCD |cos q*| ~ 0.6, usually z or Jet 2 Jet 2 (rare)
Data Sample and Analysis • Data Sample • CMSSW_1_2_0 QCD dijet sample • Combine Sample using weights • Simulated in different PT hat bins • No Pileup • CaloJets reconstructed using Midpoint Cone 0.5 (Scheme B CaloTowers) • MCJet corrections applied to Calo Jets • Generated, Calo and Corrected Calo Jets being considered • We also study partons from hard collision. • Analysis • Looking at dσ/dM for two leading jets residing in | η | cut • Dijet Ratio = N ( | η | < 0.5 )/ N ( 0.5 < | η | < 1.0 )
Dijet Ratio for QCD • Ratio is roughly flat at 0.6 . • Similar to ratio from ORCA in PTDR II.
Ratio with Multiple Jet Type • Ratio from Corrected CaloJets and GenJets are similar at 0.6 . • Ratio from CaloJets is higher due to response variations versus η. • Jet response in |η| < 0.5 is slightly greater than 0.5 < |η| < 1.0 • Expected 1 – 2% change in relative jet response in two |η| regions can cause the difference that we see here ( from PTDR II).
Dijet Ratio for QCD • Ratio is roughly flat at 0.6 . • No difference between partons and genjets at low mass and around 5% at high mass.
Contact Interaction Signal • Canonical model among left handed composite quarks given by Eichten, Lane and Peskin. • All quarks participating in contact interaction. • Signals generated in multiple PT hat bins, like QCD. • Generated jets reconstructed using Midpoint cone 0.5 • Didn’t run full CMS detector simulation • Good agreement between corrected calo jets and generated gen jets.
dσ/dM from QCD & Contact Signal QCD QCD + Contact Interaction • Signal is contributing at high mass and at low |η|.
Dijet Ratio with MC Statistics • Dijet ratio for signal increases with increase in dijet mass. • Smaller compositeness scales have larger effect on dijet ratio at higher dijet mass. • QCD background is relatively flat versus dijet mass.
Dijet Ratio with MC Statistics • Until we get to very high scales & high dijet masses the partons are almost identical to the genJets for the ratio.
Dijet Ratio Early in CMS • Statistical error bars on QCD dijet ratio are expected error bars • Plots have been updated to use Poisson statistics • For 10 pb-1, we should be sensitive to ~3 TeV scale (new, not in PTDR II) • For 100 pb-1, we should be sensitive to 5 TeV scale (as in PTDR II) • Last Tevatron limit on compositeness scale is 2.7 TeV at 95% confidence level for integrated luminosity of 100 pb-1.
Dijet Ratio Later in CMS • With 1–10 fb-1, we will be sensitive to scales of 10-15 TeV (Same as in PTDR II). • Smaller the compositeness scale, the larger its effect.
where for each bin i Δi - Difference between QCD plus contact interaction and QCD σi - Statistical uncertainty on QCD. Sensitivity Estimates
Significance CMSSW with Stat Errors only PTDR2 • Last Tevatron limit on compositeness scale is 2.7 TeV at 95% confidence level for integrated luminosity of 100 pb-1. • With only 10 pb-1 of data, CMS will be able to discover or exclude the present Tevatron limit on compositeness scale.
Procedure • All our estimates are smooth, without statistical fluctuations in either the background or the signal. • χ2 between QCD plus contact interaction and QCD will represents our sensitivity of signal with respect to background. • We need sensitivity to be maximum, i.e. χ2 should be maximum. • Calculate χ2 as function of inner and outer η cut. • Optimized η cut will corresponds to maximum χ2 . • Only consider outer η cut up to 1.3 • Maximum value to stay within the Barrel • Optimal choice of η cut for resonance search (May 18 SUSY/BSM meeting)
χ2 from (QCD + Signal) & QCD Outer η cut Inner η cut Consider only the statistical error. • χ2 for optimum value of η cuts is 199.9 . • ηinner = 0.7 & ηouter = 1.3
Dijet Ratio for optimized η cuts η cut from Tevatron Optimized η cut • With optimized η cut, signal sensitivity has been enhanced.
Significance from optimized η cuts ηinner = 0.5 & ηouter = 1.0 ηinner = 0.7 & ηouter = 1.3 * Statistical Error only
Conclusions & Next Steps • We have done the first study of the dijet ratio with CMSSW. • Results are similar to Physics TDR II. • We have optimized the η cuts for best sensitivity to contact interactions within the barrel. • ηinner = 0.7 & ηouter = 1.3 • With only 10 pb-1 of data , CMS is sensitive (statistical error only) to • contact interaction just beyond the current Tevatron limit. • exclude the compositeness scale up to 5.3 TeV at 95% CL. or • discover the compositeness scale up to 4.1 TeV at 5σ level. • Working on CMS Internal Note • We will try to incorporate systematics.