Download
1 / 15
160 likes | 338 Views
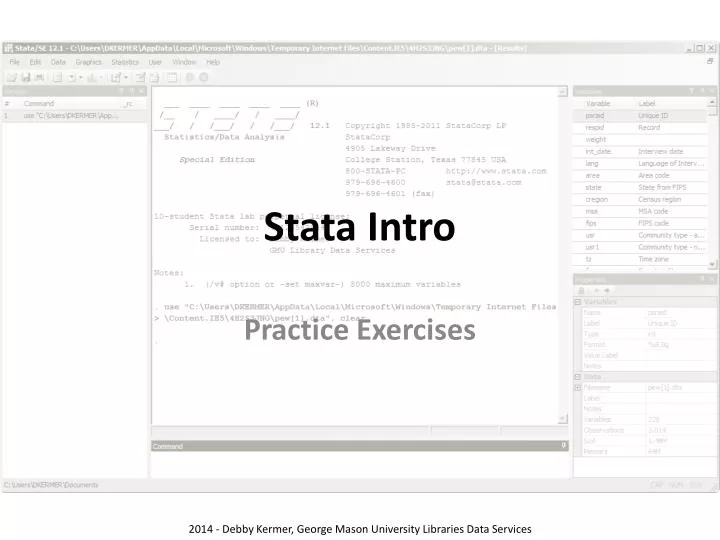
Stata Intro. Practice Exercises. 2014 - Debby Kermer, George Mason University Libraries Data Services. Instructions. Create and run syntax to accomplish each task. Press the spacebar to see the next instruction, an answer or a hint. Open the Pew Social Trends Dataset

E N D
Stata Intro Practice Exercises 2014 - Debby Kermer, George Mason University Libraries Data Services
Instructions Create and run syntax to accomplish each task. Press the spacebar to see the next instruction, an answer or a hint. Open the Pew Social Trends Dataset ___ "http://dataservices.gmu.edu/files/pew.dta" OR File | Open… [type in] http://dataservices.gmu.edu/files/pew.dta use hint
1 Exercise 1 Using Help
1a summarize Need to create yrborn? generate yrborn = 2014 - age Produce statistics about yrborn using the summarize command summarize yrborn Open the help for that command help summarize Modify the syntax to… … use abbreviations sum yrborn orsum yr orsu y … display additional statistics sum yr, detail <continues…> sum yr, _____ hint
1b sum yr if (________)sum yr if (________) summarize yrborn … ignore those who refused to give their age sum yr if (age != 99)sum yr if (age < 99) Now, summarize age, ignoring those who refused to answer sum age if (age < 99) … and ALSO display additional statistics sum age if (age < 99), detail Forgot which value meant refused? label list AGE 3 hints Your result should look like ↓ Variable | Obs Mean Std. Dev. Min Max ----------+-------------------------------------------------- yrborn | 2948 1963.089 18.01353 1915 1995
1c Extra Challenge Compare average ageby Region (cregion) tabcregion, sum(age) Notice how this is a combination of both tabcregion - frequencies for categorical variables and sum age- means for numeric variables But, summarize is used as an option, so the comma and parentheses are necessary hint See the help page we used as an example: help tab then tabulate, summarize()
2 Exercise 2 Indicator Variables
2a Make a new variable "voted" indicating those who voted in the '04 election. Voters should have a 1, non-voters should have a 0. First, get information about the variable you will use: codebook pvote04a Then, create your variable: generate voted ___________ use tab pvote04a voted to check your work: codebook ________ hint 3 hints generate voted = (________) generate voted = (pvote == 1)
2b If you want, this is how you can label the variable "voted" labelvariable"Voted in the '04 Election" labeldefineyesno1 "Yes" 0 "No"labelvaluesvotedyesno("yesno" is a made-up name, you can use anything) Now, you try: label the variable"youth" appropriately lab var "Youth: age < 30" lab def under30 1 "< 30 yrs old" 0 "30 yrs and up"lab val youth under30 Need to create "youth"? generate youth = (age < 30)replace youth = .if (age == 99)
2c Extra Challenge In one statement (i.e., one line of syntax), create a variable legal indicating only those of legal drinking age genlegal = (age >= 21) &(age < 99) genlegal = (age >= 21) if(age < 99) Although both of the above are good, the values generated by these two commands are not identical. How do they differ? legal | Freq. ------+------- 1 | 2,842
3 Exercise 3 Illustrating Relationships
3a Show the relationship between age group and voting rate What variables can you use? youth and voted What command can you use? Open help. help tab thentabulate twoway Construct your syntax tab youth voted___________ Use options to include percentages, like this ↓ 3 hints | voted youth | 0 1 | Total -------+----------------------+---------- 0 | 18.68 81.32 | 100.00 1 | 47.65 52.35 | 100.00 -------+----------------------+---------- Total | 23.05 76.95 | 100.00 Pearson chi2(1) = 179.6007 Pr = 0.000
3b Show the relationship between age group and voting rate • • • tab youth voted, row nofreq chi2 | voted youth | 0 1 | Total -------+----------------------+---------- 0 | 18.68 81.32 | 100.00 1 | 47.65 52.35 | 100.00 -------+----------------------+---------- Total | 23.05 76.95 | 100.00 Pearson chi2(1) = 179.6007 Pr = 0.000 So, is there a relationship between age and voting? Among those younger than 30, 52% voted. But, among those 30 or older, 81% voted. Youth were less likely to have voted (p < .001). hint
3c Extra Challenge What are the 4 ways the tabulatecommand can be written? tabyouth1-way, frequenciestabyouth voted 2-way, crosstab / contingeny tabletab youth voted cregion too many variables tab1y vote cr → tab y + tab vote +tab cr tab2y vote cr → tab y vote + tab vote cr + tab y cr taby , sum(vote) → tab y +sum vote Means by Grouptaby cr, sum(vote) → tab y cr +sum vote Pivot Table
That's All! Thanks for trying the Stata Exercises. If you have any questions about using Stata contact Debby Kermer at dkermer@gmu.edu or see our online resources at: http://dataservices.gmu.edu/software/stata