Download
1 / 21
210 likes | 313 Views
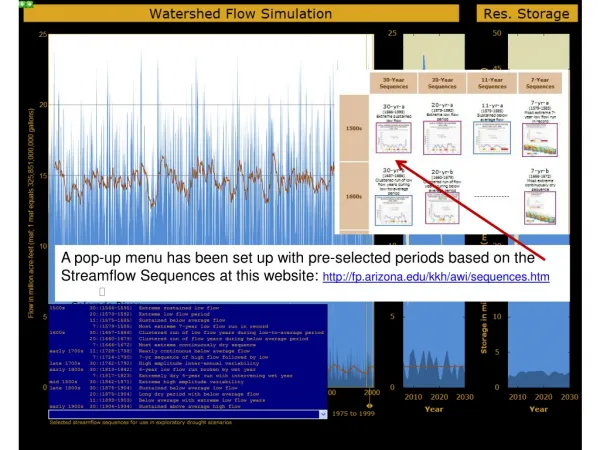
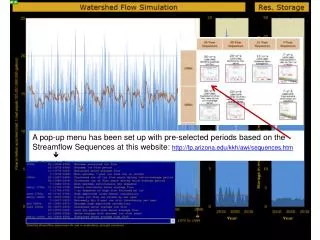
A pop-up menu has been established with pre-selected periods based on the Streamflow Sequences available at http://fp.arizona.edu/kkh/awi/sequences.htm. The orange horizontal lines in the panel depict the running mean for each basin, concluding with a 25-year simulation. For instance, the simulation is for a 25-year period starting from the first year of the 7-year sequence (1579). Detailed descriptions of each streamflow sequence can be accessed through the blue menu window, enhancing analysis and understanding of historical water flow patterns.

E N D
A pop-up menu has been set up with pre-selected periods based on the Streamflow Sequences at this website: http://fp.arizona.edu/kkh/awi/sequences.htm
The orange horizontal lines in this panel represent the running mean for the period ending with the 25 year simulation of each basin First example: The simulation is for 25 years, but starts with the first year of the 7-year sequence (1579) The description of each streamflow sequence is in the blue menu window