Download
1 / 30
300 likes | 425 Views
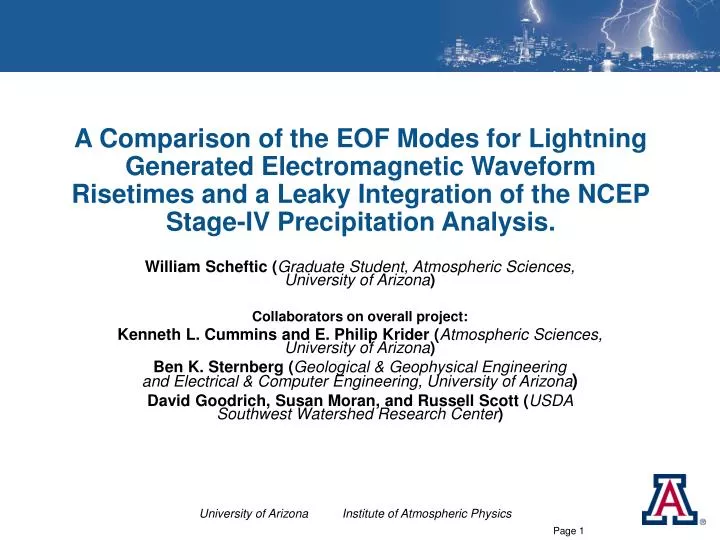
A Comparison of the EOF Modes for Lightning Generated Electromagnetic Waveform Risetimes and a Leaky Integration of the NCEP Stage-IV Precipitation Analysis. William Scheftic ( Graduate Student, Atmospheric Sciences, University of Arizona ) Collaborators on overall project:

E N D
A Comparison of the EOF Modes for Lightning Generated Electromagnetic Waveform Risetimes and a Leaky Integration of the NCEP Stage-IV Precipitation Analysis. William Scheftic (Graduate Student, Atmospheric Sciences, University of Arizona) Collaborators on overall project: Kenneth L. Cummins and E. Philip Krider (Atmospheric Sciences, University of Arizona) Ben K. Sternberg (Geological & Geophysical Engineering and Electrical & Computer Engineering, University of Arizona) David Goodrich, Susan Moran, and Russell Scott (USDA Southwest Watershed Research Center)
Outline • Motivation and Background • Technical Basis • Brief Explanation of Lightning Method • Data Preparation • Eigen Analysis and Results • Summary
Motivation and Background • Current Methods of Estimating soil moisture • In Situ soil moisture probes • Good time resolution and vertical resolution from 1 to 2 meters. • No expansive network of such measurements, point estimates • Satellite-Based Near-surface (few cm) measurements (e.g. AMSR-E). • High spatial and moderate temporal resolution. • GRACE satellites measure total column changes of weight for the Earth • Resolution around 400 km every 30 days • Land Surface Models (LSMs) • Estimates soil moisture with depth based on estimated precipitation, evaporative flux and runoff.
Motivation and Background • Focus of this talk: • New approach using Lightning in conjunction with the National Lightning Detection Network (NLDN). • Measurements may be possible with depth of a few meters along lightning to sensor path. • During periods of frequent lightning spatial and temporal resolution of soil moisture estimate may be excellent. • Goal is to achieve a national dataset with approximately 30 km spatial resolution.
Technical Basis: Effect of finite conductivity on surface-wave signal propagation • At a given frequency complex attenuation (magnitude and phase change) is proportional to distance traveled and inversely proportional to conductivity (Norton 1937).
Lightning Background Cloud-to-ground lightning electromagnetic fields: (b) First, and (c) Subsequent strokes
Propagation Animation - 75->450 km distanceConductivity = 5 mS/m 75 km
Basic Lightning Method Basic LTG Method • Select desired path for analysis • Starting at a polygon that defines the lightning-observation region • Ending at a sensor location (e.g., Lordsburg; Williams) • Evaluate risetime of lightning waveform measured by the selected sensor. • Convert risetime to apparent electrical conductivity. • RT ≈ d/σ • Convert apparent conductivity to soil moisture Window Rock Williams Polygon Yuma Tucson 200 km Lordsburg Sensor Path
Soil Moisture Proxy: NCEP Stage IV Precip • Dataset: Hourly data at 5 km spatial resolution. • Accumulated with 0.5% leak-out per hour.
Data Preparation: continued • Created spatial grids of risetime and leaky precip over southern Arizona and New Mexico. • 0.333° x 0.333° resolution. • 31N to 35N and 111.833W to 107W. • Created 8 two week periods with one week overlap. • Only used leaky precip during lightning observations periods. • Then averaged over the 8 time periods. • Missing data in a grid was interpolated as an average of its neighbors. • In analysis comparing anomaly of leaky precip with standardized anomaly of risetime.
Then average leaky precip from each grid box to the lightning sensor, to simulate conductivity along the path. Data Preparation: Path Averaging
Eigen Analysis: Methods Used • Performed SVD analysis on the risetime data, the leaky precip, and the path averaged leaky precip to yield space (EOFs) and time (PCs) eigenvectors. • Tested correlation and significance of the principle components of each field with the principle components of the other fields. • Eigenvalue Projection: In SVD analysis, • A = USVT • If A is the risetime and B is the leaky precip then, • The diagonal of U-1BVT-1 is related to the variance accounted for by risetime in the leaky precip. • If the diagonals can explain a similar amount of variance as the eigenvalues of Leaky Precip, then there is reason to believe the principle components are explaining the same phenomenon.
Eigen Analysis: Eigenvalue Projections • Recall we are seeing how the PCs of risetime project onto the Precipitation datasets. • For leaky precip the projection is about 35% of the original eigenvalue for the 1st PC • For path averaged leaky precip its around 40% • Don’t want to infer too much from this, but it seems the variability in the 1st PC of leaky precip can be explained by risetime variability.
Limitations • Other factors affect conductivity changes • Soil temperature, soil salinity, conductivity gradient over a several-meter depth • The size of the lightning region being analyzed determines how similar lightning to sensor paths really are • Rise-time effect can only be observed over distances of at least 50 km, given ~10 mS/m conductivity • No perfect set of wide-area data for validation • Stage IV precip based on radar data with rain gauge correction. • Soil moisture guages are point-specific • Land-surface models are only as good as their input. • Must have lightning!! • This really creates problems with this type of analysis (missing data, dry periods)
Summary and Future Work • Norton model shows that a change in conductivity or distance at a given frequency has a well-behaved change in the attenuation of a wave propagating along the surface • The risetime of lightning is one phenomenon where this effect is seen. • We’ve shown that a decrease in lightning risetime is related to an increase in soil moisture. • Although, the eigenvalue analysis wasn’t significant, there definitely seems to be a qualitatively interesting and physically valid reason for the 1st PC. • Try Rotated EOF analysis, to see if localized spatial patterns of risetime and leaky precip agree more. • We are working on a general method for characterizing conductivity changes for any given path based on soil characteristics. • Also, we need to further examine how other factors (soil temperature, ice content, etc) effect the conductivity of soil. • Develop methods for producing gridded spatial output of conductivity changes. • Analyze lightning data in different locations and times.