Download
1 / 42
430 likes | 773 Views
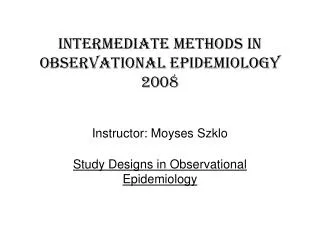
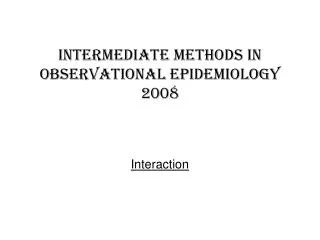
Intermediate methods in observational epidemiology 2008. Confounding - I. OBSERVATION VS. EXPERIMENT. Confounding variable :. Absent, mortality = 10%. Present, mortality = 50%. Observational (n= 2000). Experimental (n=2000). 1300. 700. 1300. 700. No intervention. Intervention.

E N D
Intermediate methods in observational epidemiology 2008 Confounding - I
OBSERVATION VS. EXPERIMENT Confounding variable: Absent, mortality = 10% Present, mortality = 50% Observational (n= 2000) Experimental (n=2000) 1300 700 1300 700 No intervention Intervention Intervention No intervention 800 200 500 500 650 350 650 350 Deaths 65 175 65 175 50 250 180 300 240 240 Mortality 18% 30% 24% 24% 80 100
(DUAL) ASSOCIATION OF CONFOUNDING VARIABLE WITH BOTH OUTCOME AND INDEPENDENT VARIABLE Less common in the group that undergoes the intervention Confounding variable Increased mortality (“outcome”)
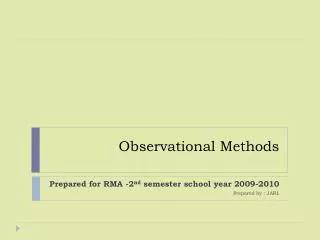
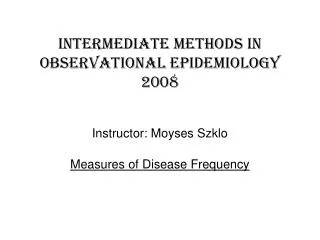
Confounding variable: Absent, mortality = 10% No intervention Intervention Present, mortality = 50% 50 No. Deaths: 80 250 100 One of the solutions to eliminate confounding: stratify 30% Mortality: 18% 800 200 500 500 180 300
A variable is only a confounder if dual association is present ? MI BP Age Israeli Study, see Kahn & Sempos, pp. 105 OR= 1.88 • Is the association causal? • Is it due to a third (confounding) variable (e.g., age)?
Does age meet the criteria to be a confounder? Yes OR= 3.0 OR= 3.4
(DUAL) ASSOCIATION OF AGE WITH BOTH SYSTOLIC HYPERTENSION AND MYOCARDIAL INFARCTION Increased odds of systolic hypertension (“exposure”) Age Increased odds of myocardial infarction (“outcome”)
CONFOUNDING EFFECT … and not in the causality pathway between exposure and outcome: Exposure Confounder Outcome Exposure Confounder Outcome
Odds Ratios not homogeneous Blood Pressure MI Risk 0.9 1.9 NO • Is it appropriate to calculate an adjusted OR? Assumption when doing adjustment: Homogeneity of odds ratios (no multiplicative interaction).
Ways to assess if confounding is present: Strategy 1:Does the variable meet the criteria to be a confounder (relation with exposure and outcome)? Strategy 2: If the effect of that variable (on exposure and outcome) is controlled for (e.g., by stratification or adjustment) does the association change?
Ways to control for confounding • During the design phase of the study: • Randomized trial • Matching • Restriction • During the analysis phase of the study: • Stratification • Adjustment • Stratified methods • Direct method • Mantel-Haenszel adjustment of Odds Ratios • Regression methods
Matching in a Case-Control Study • Objective: To achieve comparability between cases and controls with regard to confounding variables • Technique: For each case, choose a control without the case disease, of the same or similar age, at same service, same sex, etc.
Example of Matched Case-Control Study • Cases: aplastic anemia seen in Baltimore from 1978-80 • Controls: patients with non-hematologic/nonmalignant disorders, matched to cases on age (± 5 years), sex, ethnic background and hospital of admission • Hypothesis: subclinical HBV is associated with Aplastic Anemia
42 yr old black woman 40 yr old white male 57 yr old white woman 55 yr old white woman 48 yr old black men 44 yr old AA woman- diab. 37 yr old white male- MI 60 yr old white woman- AP 55 yr old white woman- lupus 49 yr old AA men- meningioma Matched case-control study Cases of Aplastic Anemia Controls (Patients)* (*Admitted to the same hospital as index case with other diseases)
Pairs of Cases and Controls Individually Matched by Age and Sex
Pairs of Cases and Controls Individually Matched by Age and Sex
Pairs of Cases and Controls Individually Matched by Age and Sex
Pairs of Cases and Controls Individually Matched by Age and Sex
Pairs of Cases and Controls Individually Matched by Age and Sex
Pairs of Cases and Controls Individually Matched by Age and Sex
Odds Ratio for Matched Case-Control Studies Favors hypothesis Against hypothesis = 4/2= 2.0
Risk Factors for Brain Tumors in Subjects Aged <20 years: A Case-Control Study (Gold et al, Am J Epidemiol 1979;109:309-19) • Exploratory study of risk factors for brain tumors • Subjects < 20 yrs old • Cases: primary malignant brain tumors in Baltimore in 1965-75 • Normal controls: chosen from birth certificates on file, and matched on cases by sex, date of birth (±1 year) and race • Interviews with parents of children
Exposed: 3629+ g Unexposed: <3629 g Cases’ birth weight 3629+ g <3629 g Controls’ birthweight 3629+ g 8 7 <3629 g 18 38 Risk Factors for Brain Tumors: Birthweight Odds Ratio= 18/7= 2.6 (Gold et al, Am J Epidemiol 1979;109:309-19)
A few notes on “Matching” • Most frequently used in case-control studies • Frequency vs. individual matching • Advantages: • Intuitive, easy to explain • Guarantees certain degree of comparability in small studies • Efficient (if matching on a strong confounder) • Particularly useful when outpatients are studied, and sample size is relatively small (e.g., <100 cases and <100 controls) • Example: Case-control study of risk factors for emphysema: • For each newly diagnosed case of emphysema seen in an Outpatient Unit, select the next (control) patient without diabetes, with an age ± 2 years, of the same sex, and educational status • Disadvantages: • Costly, usually logistically complicated • Inefficient if matching on a weak confounder • Questionable representativiness of control group (limits its use for other case-control comparisons) • Cannot study the matching variable (and additive interaction) • Possibility of residual confounding
Further issues for discussion • Types of confounding • Confounding is not an “all or none” phenomenon • Residual confounding • Confounder might be a “constellation” of variables or characteristics • Considering an intermediary variable as a “confounder” for examining pathways • Statistical significance and confounding
Types of confounding • Positive confounding When the confounding effect results in an overestimation of the effect (i.e., the crude estimate is further away from 1.0 than it would be if confounding were not present). • Negative confounding When the confounding effect results in an underestimation of the effect (i.e., the crude estimate is closer to 1.0 than it would be if confounding were not present).
Type of confounding: PositiveNegative 3.0 x TRUE, UNCONFOUNDED 5.0 OBSERVED, CRUDE 3.0 x 2.0 0.4 x 0.3 x 0.4 0.7 3.0 X ? 0.7 1 0.1 10 Relative risk
Confounding is not an “all or none” phenomenon A confounding variable may explain the whole or just part of the observed association between a given exposure and a given outcome. • Crude OR=3.0 … Adjusted OR=1.0 • Crude OR=3.0 … Adjusted OR=2.0 • Residual confounding Controlling for one of several confounding variables does not guarantee that confounding be completely removed. Residual confounding may be present when: - the variable that is controlled for is an imperfect surrogate of the true confounder, - other confounders are ignored, • the units of the variable used for adjustment/stratification are too broad • the confounding variable is misclassified • The confounding variable may reflect a “constellation” of variables/characteristics • E.g., Occupation (SES, physical activity, exposure to environmental risk factors) • Healthy life style (diet, physical activity)
Residual Confounding: Relationship Between Natural Menopause and Prevalent CHD (prevalent cases v. normal controls), ARIC Study, Ages 45-64 Years, 1987-89
Confounding is not an “all or none” phenomenon A confounding variable may explain the whole or just part of the observed association between a given exposure and a given outcome. • Crude OR=3.0 … Adjusted OR=1.0 • Crude OR=3.0 … Adjusted OR=2.0 • Residual confounding Controlling for one of several confounding variables does not guarantee that confounding be completely removed. Residual confounding may be present when: - the variable that is controlled for is an imperfect surrogate of the true confounder, - other confounders are ignored, • the units of the variable used for adjustment/stratification are too broad • the confounding variable is misclassified • The confounding variable may reflect a “constellation” of variables/characteristics • E.g., Occupation (SES, physical activity, exposure to environmental risk factors) • Healthy life style (diet, physical activity)
Treating an intermediary variable as a confounder (i.e., ignoring “the 3rd rule”) Under certain circumstances, it might be of interest to treat an hypothesized intermediary variable acting as a mechanism for the [risk factor-outcome] association as if it were a confounder (for example, adjusting for it) in order to explore the possible existence of additional mechanisms/pathways.
exposure Obesity Hypertension confounder Mortality outcome Confounding factor or part of the chain of causality? Example: relationship of obesity to mortality Scenario 1: The relationship of obesity to mortality is confounded by hypertension, i.e., the relationship is statistical but not causal
exposure Obesity Hypertension Mortality outcome Confounding factor or part of the chain of causality? Example: relationship of obesity to mortality Scenario 2: The relationship of obesity to mortality is causal and mediated by hypertension mediator
exposure Obesity Hypertension mediator Mortality outcome Confounding factor or part of the chain of causality? Example: relationship of obesity to mortality Scenario 3: In addition to being mediated by hypertension, the causal relationship of obesity to mortality is direct
exposure Obesity Obesity Other mechanisms, e.g., diabetes Hypertension mediator Mortality Mortality outcome Confounding factor or part of the chain of causality? Example: relationship of obesity to mortality Scenario 4: In addition to being mediated by hypertension, the causal relationship of obesity to mortality is mediated by other mechanisms
exposure Obesity Obesity Other mechanisms, e.g., diabetes Hypertension mediator Mortality Mortality outcome Confounding factor or part of the chain of causality? Example: relationship of obesity to mortality The different scenarios are not mutually exclusive!
Obesity and Mortality For positive associations (exposures associated with a RR> 1.0):
BAD IDEA! If the confounder is strongly associated with the exposure, even a small difference between cases and controls (not statistically significant because of limited sample size) may still induce confounding… and vice versa Case-cont Confounder ? Exposure Statistical significance as criteria to assess the presence of confounding E.g., a confounder might be ruled out in a case-control study solely because there is no statistically significant difference in the levels of the confounder comparing cases and controls. E.g., Study of menopause as predictor of myocardial infarction. Even a small difference in age between cases and controls (e.g., 1 year, NS) may result in confounding due to the strong association between age and “exposure” (menopause).
Example: Menopause as a risk factor Odds Ratio= 60/40 ÷ 50/50 = 1.5 % post-menopausal Age (years) 55 56
controls cases Odds Ratio= 60/40 ÷ 50/50 = 1.5 % post-menopausal Age (years) 55 56