Download
1 / 51
590 likes | 867 Views
AP Biology Lab Review. Lab 1: Artificial Selection. Description Germinate Wisconsin Fast Plant seeds Count leaf hairs on each plant Allow plants with the most hairs to flower, then cross-pollinate. Seed forms, plant it. Count hairs on F1 generation . Concepts Artifical selection

E N D
Lab 1: Artificial Selection • Description • Germinate Wisconsin Fast Plant seeds • Count leaf hairs on each plant • Allow plants with the most hairs to flower, then cross-pollinate. • Seed forms, plant it. • Count hairs on F1 generation. • Concepts • Artifical selection • Inheritance • Quantitative traits • Sexual reproduction in plants
Lab 2: Population Genetics (Hardy-Weinberg) • Description • simulations were used to study effects of different parameters on frequency of alleles in a population • selection • heterozygous advantage • genetic drift
Lab 2: Population Genetics • Concepts • Hardy-Weinberg equilibrium • p + q = 1 • p2 + 2pq + q2 = 1 • required conditions • large population • random mating • no mutations • no natural selection • no migration • gene pool • heterozygous advantage • genetic drift (more significant in small populations) • founder effect • bottleneck
Lab 2: Population Genetics • Conclusions • recessive alleles remain hidden in the pool of heterozygotes • even lethal recessive alleles are not completely removed from population • know how to solve H-W problems! • to calculate allele frequencies, use p + q = 1 • to calculate genotype frequencies or how many individuals, use, p2 + 2pq + q2 =1
Lab 2: Population Genetics ESSAY 1989 Do the following with reference to the Hardy-Weinberg model. a. Indicate the conditions under which allele frequencies (p and q) remain constant from one generation to the next. b. Calculate, showing all work, the frequencies of the alleles and frequencies of the genotypes in a population of 100,000 rabbits of which 25,000 are white and 75,000 are agouti. (In rabbits the white color is due to a recessive allele, w, and agouti is due to a dominant allele, W.) c. If the homozygous dominant condition were to become lethal, what would happen to the allelic and genotypic frequencies in the rabbit population after two generations?
Lab 3: Comparing DNA Sequences To Understand Evolutionary Relationships (BLAST Lab) • Description • BLAST: database into which you can input a gene sequence and search genomic libraries for similar sequences. • Use BLAST to compare several genes, then use the information to construct a cladogram • Concepts • Human genome • Genomic library • Cladogram • Common Ancestor • Shared derived characters, shared primitive characters • Conclusion • Gene sequences help us understand evolutionary relationships among organisms • Organisms with more similar DNA sequences share a more recent common ancestor.
Lab 4: Diffusion & Osmosis • Description • dialysis tubing filled with starch-glucose solution in beaker filled with KI solution • potato cores in sucrose solutions • determining solute concentration of different solutions
Lab 4: Diffusion & Osmosis • Concepts • semi-permeable membrane • diffusion • osmosis • solutions • hypotonic • hypertonic • isotonic • water potential • solute potential
Lab 4: Diffusion & Osmosis • Conclusions • water moves from high concentration of water (hypotonic=low solute) to low concentration of water (hypertonic=high solute) • solute concentration & size of molecule affect movement through semi- permeable membrane • Water potential. Important in plant cells. • Water moves from areas of high water potential to areas of low water potential. • Ѱ = Ѱp + Ѱs • Ѱs = -iCRT
Lab 4: Diffusion & Osmosis ESSAY 1992 A laboratory assistant prepared solutions of 0.8 M, 0.6 M, 0.4 M, and 0.2 M sucrose, but forgot to label them. After realizing the error, the assistant randomly labeled the flasks containing these four unknown solutions as flask A, flask B, flask C, and flask D. Design an experiment, based on the principles of diffusion and osmosis, that the assistant could use to determine which of the flasks contains each of the four unknown solutions. Include in your answer: • a description of how you would set up and perform the experiment; • the results you would expect from your experiment; and • an explanation of those results based on the principles involved. Be sure to clearly state the principles addressed in your discussion.
Lab 5: Photosynthesis • Description • Air was pulled out of leaf disks using a syringe. • Disks sank to the bottom of a cup. Placed under light source, disks began to float to the top.
Lab 5: Photosynthesis • Concepts • Photosynthesis • Leaf structure: mesophyll layer • Experimental design • Conclusion • Photosynthesis produces oxygen • Rate of photosynthesis increases as light increases.
Lab 6: Cellular Respiration • Description • using respirometer to measure rate of O2 production by pea seeds • Concepts • respiration • experimental design • control vs. experimental • function of KOH • function of vial with only glass beads
Lab 6: Cellular Respiration • Conclusions • temp = respiration • germination = respiration calculate rate
Lab 6: Cellular Respiration ESSAY 1990 The results below are measurements of cumulative oxygen consumption by germinating and dry seeds. Gas volume measurements were corrected for changes in temperature and pressure. a. Plot the results for the germinating seeds at 22°C and 10°C. b. Calculate the rate of oxygen consumption for the germinating seeds at 22°C, using the time interval between 10 and 20 minutes. c. Account for the differences in oxygen consumption observed between: 1. germinating seeds at 22°C and at 10°C 2. germinating seeds and dry seeds. d. Describe the essential features of an experimental apparatus that could be used to measure oxygen consumption by a small organism. Explain why each of these features is necessary.
Lab 7: Cell Division: Mitosis & Meiosis • Part II. Effects of Environment on Mitosis • Teacher provided untreated and lectin-exposed roots • Students made squash-mount, stained chromosomes • Counted the number of cells in each stage of mitosis • Concepts • Mitosis: IPMAT • Control of the cell cycle: cyclins and CDKs, checkpoints • Lectin is a chemical secreted into the soil by fungi that increases mitosis in plant roots. • Chi-square test: Compare number of observed cells in each phase of mitosis to number of expected
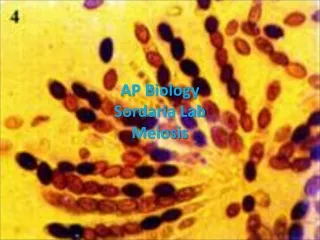
Lab 7: Cell Division: Mitosis & Meiosis • Part IV. Meiosis and Crossing Over in Sordaria • observed crossing over in fungus, Sordaria • Looked at pictures of asci where the heterozygous fungi produced both black and tan spores.
total crossover % crossover = total offspring Lab 7: Cell Division: Mitosis & Meiosis • Conclusions • Crossover frequency and map units • farther gene is from centromere the greater number of crossovers • 1 map unit = 1% cross-over
Lab 8: Biotechnology: Bacterial Transformation • Description • Bacteria is induced to take up pieces of foreing DNA • insert foreign gene (GFP) in bacteria by using engineered plasmid • also insert ampicillin resistant gene on same plasmid as selectable marker
Lab 8: Biotechnology: Bacterial Transformation • Conclusions • can insert foreign DNA using vector • ampicillin becomes selecting agent • no transformation = no growth on amp+ plate
Lab 9: Biotechnology: Restriction Enzyme Analysis of DNA • Description • Chopped up plasmid using restriction enzymes HindIII and EcoRI • Loaded plasmid into a gel • Electrophoresis: a current pulls negatively charged DNA toward positive electrode. • Smaller pieces move faster • Concepts • Plasmids • Restriction Enzymes • Recombination (“sticky ends”) • Selectable marker • ampicillin resistance • DNA ladder
Lab 6: Molecular Biology ESSAY 1995 The diagram below shows a segment of DNA with a total length of 4,900 base pairs. The arrows indicate reaction sites for two restriction enzymes (enzyme X and enzyme Y). • Explain how the principles of gel electrophoresis allow for the separation of DNA fragments • Describe the results you would expect from electrophoretic separation of fragments from the following treatments of the DNA segment above. Assume that the digestion occurred under appropriate conditions and went to completion. • DNA digested with only enzyme X • DNA digested with only enzyme Y • DNA digested with enzyme X and enzyme Y combined • Undigested DNA • Explain both of the following: • The mechanism of action of restriction enzymes • The different results you would expect if a mutation occurred at the recognition site for enzyme Y.
Lab 10: Energy Dynamics • Description • Examine interactions between producers and consumers in a community. • Grow fast plants and butterfly larvae together. • Estimate net primary productivity of plant. • Measure flow of energy from plants to butterfly larvae
Lab 10: Energy Dynamics • Concepts • Biomass • Net primary productivity • Ecological pyramids • Community • Producers and consumers
Lab 11: Transpiration • Description • test the effects of environmental factors on rate of transpiration • temperature • humidity • air flow (wind) • light intensity
Lab 11: Transpiration • Concepts • transpiration • stomates • guard cells • xylem • adhesion • cohesion • H bonding
Lab 11: Transpiration • Conclusions • transpiration • wind • light • transpiration • humidity
Lab 11: Transpiration ESSAY 1991 A group of students designed an experiment to measure transpiration rates in a particular species of herbaceous plant. Plants were divided into four groups and were exposed to the following conditions. Group I: Room conditions (light, low humidity, 20°C, little air movement.) Group II: Room conditions with increased humidity. Group III: Room conditions with increased air movement (fan) Group IV: Room conditions with additional light The cumulative water loss due to transpiration of water from each plant was measured at 10-minute intervals for 30 minutes. Water loss was expressed as milliliters of water per square centimeter of leaf surface area. The data for all plants in Group I (room conditions) were averaged. The average cumulative water loss by the plants in Group I is presented in the table below. • Construct and label a graph using the data for Group I. Using the same set of axes, draw and label three additional lines representing the results that you would predict for Groups II, III, and IV. • Explain how biological and physical processes are responsible for the difference between each of your predictions and the data for Group I. • Explain how the concept of water potential is used to account for the movement of water from the plant stem to the atmosphere during transpiration.
Lab 12: Fruit Fly Behavior • Description • Fruit Flies in choice chamber • Different substances at each end. • Count the number of flies on each side at regular time intervals. • Experimental design. • Concepts • Model research organism • Taxis (directed) • Kinesis (random) • Controlled experiment
Lab 13: Enzyme Activity • Description • H2O2 H2O + O2 • measuredrate ofO2production • measured factors affecting enzyme activity • Temperature • pH • Enzyme concentration • Substrate concentration catalase
Lab 13: Enzyme Catalysis • Concepts • substrate • enzyme • enzyme structure • product • denaturation of protein • experimental design • rate of reactivity • reaction with enzyme vs. reaction without enzyme • optimum pH or temperature • test at various pH or temperature values
Lab 13: Enzyme Catalysis • Conclusions • enzyme reaction rate is affected by: • pH • temperature • substrate concentration • enzyme concentration
Lab 13: Enzyme Catalysis ESSAY 2000 The effects of pH and temperature were studied for an enzyme-catalyzed reaction. The following results were obtained. a. How do (1) temperature and (2) pH affect the activity of this enzyme? In your answer, include a discussion of the relationship between the structure and the function of this enzyme, as well as a discussion of how structure and function of enzymes are affected by temperature and pH. b. Describe a controlled experiment that could have produced the data shown for either temperature or pH. Be sure to state the hypothesis that was tested here.
Old AP Labs Will probably show up as examples of experiments.
Lab: Photosynthesis • Description • determine rate of photosynthesis under different conditions • light vs. dark • boiled vs. unboiled chloroplasts • chloroplasts vs. no chloroplasts • use DPIP in place of NADP+ • DPIPox = blue • DPIPred = clear • measure light transmittance DPIP
Lab: Photosynthesis • Concepts • photosynthesis • Photosystem 1 • NADPH • Conclusions • Pigments • pigments move at different rates based on solubility in solvent • Photosynthesis • light & unboiled chloroplasts produced highest rate of photosynthesis
Lab: Photosynthesis ESSAY 2004 (part 1) A controlled experiment was conducted to analyze the effects of darkness and boiling on the photosynthetic rate of incubated chloroplast suspensions. The dye reduction technique was used. Each chloroplast suspension was mixed with DPIP, an electron acceptor that changes from blue to clear when it is reduced. Each sample was placed individually in a spectrophotometer and the percent transmittance was recorded. The three samples used were prepared as follows. Sample 1 — chloroplast suspension + DPIP Sample 2 — chloroplast suspension surrounded by foil wrap to provide a dark environment + DPIP Sample 3 — chloroplast suspension that has been boiled + DPIP Data are given in the table on the next page. a. Construct and label a graph showing the results for the three samples. b. Identify and explain the control or controls for this experiment. c. The differences in the curves of the graphed data indicate that there were differences in the number of electrons produced in the three samples during the experiment. Discuss how electrons are generated in photosynthesis and why the three samples gave different transmittance results.
Lab: Photosynthesis ESSAY 2004 (part 2)
Lab: Animal Behavior • Description • set up an experiment to study behavior in an organism • pillbug or mealworm kinesis • Wet vs. dry habitat • Other variables
Lab: Animal Behavior • Concepts • Taxis (directed) vs. kinesis (random) • experimental design • control vs. experimental • hypothesis • choice chamber • temperature • humidity • light intensity • salinity • other factors
Lab 11: Animal Behavior ESSAY 1997 A scientist working with Bursatella leachii, a sea slug that lives in an intertidal habitat in the coastal waters of Puerto Rico, gathered the following information about the distribution of the sea slugs within a ten-meter square plot over a 10-day period. a. For the data above, provide information on each of the following: • Summarize the pattern. • Identify three physiological or environmental variables that could cause the slugs to vary their distance from each other. • Explain how each variable could bring about the observed pattern of distribution. b. Choose one of the variables that you identified and design a controlled experiment to test your hypothetical explanation. Describe results that would support or refute your hypothesis.
Lab 11: Animal Behavior ESSAY 2002 The activities of organisms change at regular time intervals. These changes are called biological rhythms. The graph depicts the activity cycle over a 48-hour period for a fictional group of mammals called pointy-eared bombats, found on an isolated island in the temperate zone. • Describe the cycle of activity for the bombats. Discuss how three of the following factors might affect the physiology and/or behavior of the bombats to result in this pattern of activity. • temperature • food availability • presence of predators • social behavior • Propose a hypothesis regarding the effect of light on the cycle of activity in bombats. Describe a controlled experiment that could be performed to test this hypothesis, and the results you would expect.
Lab 12: Dissolved Oxygen • Description • measure primary productivity by measuring O2 production • factors that affect amount of dissolved O2 • temperature • as water temperature, its ability to hold O2 decreases • photosynthetic activity • in bright light, aquatic plants produce more O2 • decomposition activity • as organic matter decays, microbial respiration consumes O2 • mixing & turbulence • wave action, waterfalls & rapids aerate H2O & O2 • salinity • as water becomes more salty, its ability to hold O2 decreases
Lab 12: Dissolved Oxygen • Concepts • dissolved O2 • primary productivity • measured in 3 ways: • amount of CO2 used • rate of sugar (biomass) formation • rate of O2 production • net productivity vs. gross productivity • respiration
Lab 12: Dissolved Oxygen • Conclusions • temperature = dissolved O2 • light = photosynthesis = O2 production • O2 loss from respiration • respiration = dissolved O2 (consumption ofO2)
Lab 12: Dissolved Oxygen ESSAY 2001 A biologist measured dissolved oxygen in the top 30 centimeters of a moderately eutrophic (mesotrophic) lake in the temperate zone. The day was bright and sunny and the wind was calm. The results of the observation are presented below. • Using the graph paper provided, plot the results that were obtained. Then, using the same set of axes, draw and label an additional line/curve representing the results that you would predict had the day been heavily overcast. • Explain the biological processes that are operating in the lake to produce the observed data. Explain also how these processes would account for your prediction of results for a heavily overcast day. • Describe how the introduction of high levels of nutrients such as nitrates and phosphates into the lake would affect subsequent observations. Explain your predictions.