Download
1 / 18
180 likes | 346 Views
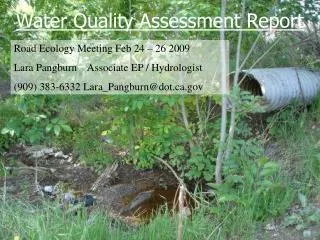
Temporal and Spatial Variability in Nitrate in Subsurface Drains in a Midwestern Agricultural Watershed. Paul Capel , USGS, National Water-Quality Assessment Program Jonathon Thornburg , University of Minnesota, Water Resources.

E N D
Temporal and Spatial Variability in Nitrate in Subsurface Drains in a Midwestern Agricultural Watershed Paul Capel, USGS, National Water-Quality Assessment Program Jonathon Thornburg, University of Minnesota, Water Resources
Temporal and Spatial Variability in Nitrate in Subsurface Drains USGS National Water-Quality Assessment Program (NAWQA) • Quantify the variability in discharge and nitrate in subsurface drainage within a single small watershed • Spatial • Temporal • Source (diameter)
Agriculture in Minnesota Major Crops: Corn Soybeans
Agriculture in Minnesota Lesser Known Crops: Grapes
There are 8.5 turkeys per Minnesotan ...
Upper portion in the South Fork Iowa River watershed • Landscape formed by recent glaciations • Des Moines Lobe • ~10,000 -13,000 BCE • Prairie potholes, ground moraines, and till plains Temporal and Spatial Variability in Nitrate in Subsurface Drains Estimated density of subsurface drainage (darker color denotes greater drainage)
Watershed Characteristics • 36.4 km2 watershed • 8 km perennial stream (Avg. Q = 0.45 m3/sec) • Average annual precipitation of 87 cm • 89 % Corn / soybean 8% ungrazed grassland (buffer strips) Temporal and Spatial Variability in Nitrate in Subsurface Drains • Yellow = Corn • Green = Soybean Source: Iowa Geologic Survey and Iowa DNR, 2002
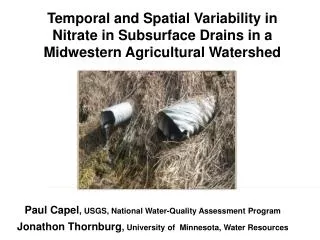
146 drains total • 93 sub-surface 8 large diameter • 60-108 cm 73 medium diameter • 27-48 cm 12 small diameter • 17-23 cm • 53 surface/overland Temporal and Spatial Variability in Nitrate in Subsurface Drains
Temporal and Spatial Variability in Nitrate in Subsurface Drains Five synoptic sampling periods July 2006 – 43 sub-surface samples Mar 2008 – 10 sub-surface samples July 2007 – 34 sub-surface samples May 2008 – 82 sub-surface samples Aug 2008 – 43 sub-surface samples
Temporal and Spatial Variability in Nitrate in Subsurface Drains Nitrate Concentrations: Summers 2006-80
Temporal and Spatial Variability Spatial Variability May 2008 Discharge Specific conductance Nitrate
Temporal and Spatial Variability in Nitrate in Subsurface Drains Variability in Nitrate Concentration byDiameter
Least amount of variability in large diameter drains • 70-87% of water in the stream from subsurface drains is from the 8 large diameter drains • 70-87% of water in the stream • 61-85% of nitrate load in the stream • Smaller drains become more important during periods of high flow Temporal and Spatial Variability in Nitrate in Subsurface Drains Variability in Concentration byDiameter
Variability in Loads as a Function of Time May 2008 had 85% more flow than other periods May 2008 had 5 to 9 times higher load of nitrate Temporal and Spatial Variability in Nitrate in Subsurface Drains Chemical load = instantaneous discharge * chemical concentration
Temporal and Spatial Variability in Nitrate in Subsurface Drains Log nitrate load versus log discharge R2 > 0.94 (for all)
Temporal and Spatial Variability in Nitrate in Subsurface Drains Comparison of Synoptics with Fixed Sites • Two fixed sampling locations • February 2007 – November 2008