Download
1 / 38
380 likes | 427 Views
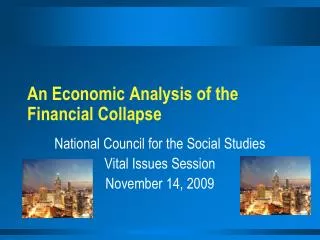
Explore the postwar economic boom, Great Depression causes, Republican policies, stock market crash, and speculation. Learn about the financial crisis and its impact.

E N D
Slide 2.1A: The Postwar Economic Boom Here we see a billboard depicting American prosperity, displayed in a run-down, barren area.
Twenties Prosperity • GNP from 1922-1929 - $61 billion to $87 billion • 43% increase • Increased consumer spending • Increased technology • Number of items produced increased 72% • Increased profits – 80% • Stock market at an all time high in 1929 • Depression foreshadowed • 1929 – cracks in the economy • Unemployment increasing • Farmers losing land • Stock values decreasing • Poverty increasing • Spending decreasing
Key factors causing the Great Depression • Republican domestic & international economic policies • Unchecked stock speculation • Weak and unregulated banking institutions • Overproduction of goods • The decline of the farming industry • Unequal distribution of wealth
Stock Market Speculation Causes of the Great Depression Bank Failures Spoke Diagram L Draw a spoke diagram like the one adjacent on the left side of your notebook, opposite slide “A”. Add spokes and important information to the appropriate section of the diagram.
Slide 2.1B: Republican Economic Policies The three leaders of the 1920s and 1930s Republican Party: President Coolidge, Secretary of the Treasury Andrew Mellon, and Herbert Hoover, former secretary of commerce and candidate to succeed Coolidge as president.
Domestic Policies • Calvin Coolidge – “The business of America is business” • “Trickle down” theory- The idea that “wealth” trickles down from the rich to the poor. • Pro-business • Benefits big business & wealthy • Tax cuts & policies • Andrew Mellon – Secretary of the Treasury • Reduced taxes on big business & $60,000 income • U.S. Steel received tax refund of $15 million • Cut government spending & increased tax on middle and lower income
Results • Corporations expanded facilities & increased production – kept $ • Created some jobs – rather new technology bought reducing human labor • Owners kept wages low – profits higher • Increased gap between rich & poor
International Economic Policies • Conservative approach • Lent $11 billion to Europe after WWI • Europe asked to release or reduce loans • Calvin Coolidge said “No” • Rescheduled loans – created deeper debt & default • High tariffs • Discouraged American purchases • Promote American-made consumer spending • Hawley-Smoot Tariff • Designed to protect American farmers and manufacturers from foreign competition. • Had the opposite effect and eventually led to unemployment in companies that could no longer export to other countries.
Results • No market for European goods – no $ to repay loans • No money to buy American products • American consumer not affected – stock market too good
Slide 2.1C: Real Estate and Stock Speculation In this slide we see a political cartoon entitled “The Anglers” showing Wall Street stockbrokers “hooking” Americans to invest in stocks through speculation.
Real Estate Speculation • Speculation – risky investment in the hope of making a quick, large profit • Widespread in the 1920s • Migration to Southern CA after WWI creates a need for more housing in the area. • Investors buy massive amounts of land for housing • exceeds demand for housing – Boom to bust • 1925 investors look to Florida • frenzied speculation, get-rich-quick schemes, unethical investment practices • speculators sell to speculators, who sell to speculators – price goes higher • Northerners buy sight unseen • Swampland • “beachfront property” – underwater at high tide • Boom turned to bust – investors left with land & loan
Unchecked Stock Speculation • Real estate to stock investment • Investors believed stocks would go up indefinitely – profits increase • Investors bought large amounts – sold for higher – made quick, easy profits • Investors that were new sold for even higher • Value of company stock artificially inflated • Some purposely inflated value to sell & make quick profit • Some would pool money & buy large amounts & create a buying frenzy to sell when high. • Stock value plummeted when pool sold out – others realized not as profitable
Dividends - Profits Speculation - Income
Predictions of failure • Economic analyst warn of inflated stocks • Herbert Hoover warned of “possible hard times are coming”
Spoke Diagram • Please add 3 spokes to your spoke diagram based off of the key factors that were discussed today. Ex 2 Ex 1 Ex 3 Stock Speculation L
Slide 2.1D: The Stock Market Crash In this slide we see a group of depositors standing outside Union Bank in New York City in April 1933, hoping that the bank would not join the growing epidemic of bank failures.
The 1929 Stock Market Crash • Analyst warn of the bull market (a market in which prices are constantly rising) and that this could not continue forever. Bull to Bear • Investors begin to sell – prices start to fall • Companies slow production – prices drop • October 24, 1929 investors flooded the market to sell • J.P. Morgan & other bankers attempt to stabilize by purchasing stocks higher than market value • October 28 – investors again rush market - $4 billion lost • October 29 – “Black Tuesday” • Sell orders swamp market • In only hours people lose fortunes • George Baker, First National Bank exec., lost $15 million • New York hotel president – jumped from ledge, $113 to $4 stock price • Total – investors lost $16 billion
Unregulated Banking Institutions • Stock Crash Triggers banking collapse • U.S. banks increasingly unstable • Over-extension of credit • Republican policy of Laissez Faire made for limited regulation of Banks. • No prevention of high risk speculation • No percentage requirement of reserve funds • Deposits uninsured – thousands of families lost everything • Buying on margin -10% - 20% down - banks lent rest – accepting stock as collateral *Stock value $20,000 * Investor - $2,000 * Bank - $18,000 loan – and access to stock if default
The Banking Industry Collapse • Stock Market Crash precipitates bank failures • Families lose savings – banks deplete already small reserves • Investors could not repay margin of credit – bank could not replace depositors $ • Unemployment soared – mortgages & other loans defaulted • Many banks closed – 1932, 6,000 (1/4)
Spoke Diagram • Please add 3 spokes to your spoke diagram based off of the key factors that were discussed today. Ex 2 Ex 1 Ex 3 Stock Market Crash L
Slide 2.1E: Over-production In the top slide we see dairy farmers emptying milk from a non-striker’s truck during a blockade near Harvard, Illinois. The strikers organized the blockade – which succeeded in preventing milk from going to market – in an effort to raise prices and heighten awareness of oversupply.
Industrial Goods • WWI technological advances • Aviation • Ground transportation • Post war advances • Agriculture, electrical power, transportation, factory production. • Changed the way American people lived • Before 1929 – production parallels stock market • Increase in purchase of material goods • Advertisement – cars, appliances, etc. • Newly invented machines increased production • Unrestricted capitalism • Expanded facilities • Increased production • Saturation of the market
Agricultural Goods • American farms prospered while supplying U.S. & European armies in WWI. • Corn, wheat & vegetables • Farmers used new technology • Became more efficient & productive • Europe resumes production • Foreign demand drops significantly • Farmers experience surplus • Prices drop & Depression hits • Farmers hit hard
The Farming Industry Decline • Farming - the backbone of America until 1929 • By 1929, US agricultural in deep decline • Farmers borrowed heavily to pay for new technologically advanced equipment • As farmers failed to sell their surplus crops, they were unable to pay back loans • Banks would then auction off all assets of the farm. • In 1929, many banks collapsed under the pressure of farming losses and the stock market.
Farmers during the Depression • From 1929-1933 farmers’ income dropped by 50% and property value losses were in the billions of dollars • To make matters worse, the Dust Bowl hits the Midwest • 1 million farmers lost their farms from 1930-1934
The Dust Bowl • Farmers headed for California in search of employment and land • Migrating farmers were known as Okies due to the allusion that they were all from Oklahoma • Many lived in makeshift shacks and shanties outside the city limits. • One such area outside Salinas Ca, called Little Oklahoma, housed 10,000 people • The living conditions in these shacks was deplorable “the dwellings were built of brush, rags, shacks, boxboards, galvanized iron, pieces of canvas and whatever else was at hand at the time of construction” Inspector of Little Oklahoma.
The Dust Bowl L Directions: • First…Complete Geography Application 14.2 • Then…on the left side of your notebook, create a map of the United States which shows the area affected by the Dust Bowl. • Use the map from the Geography Application 14.2 as an outline to trace in your notebook and the map in your text book on page 474 as a guide. • Be sure to include the following items: Outline map identifying all the states using their two letter abbreviation • Area of the Dust Bowl • Area of Damage • Area covered by the May 1934 dust storm • Route 66 from Oklahoma City to Bakersfield • Color coded key corresponding to the above mentioned items • An accurate scale showing miles and kilometers • An accurate title depicting the topic
The Gap Between Rich and Poor • 1929 Federal Trade Commission • 1% of the population possessed over 59% of the countries wealth. • 60% of the population lived at or below a minimum subsistence level of $2000 a year • African Americans, Latinos, & other non-whites even poorer • 1920-29 – Average American net increase of 9% • Rich Americans – 75% increase • American industrial workers • Replaced by machines • 1929 – 1,100 Connecticut rubber factory workers lost jobs • 35,000 orchestra musicians replaced by “machine music” • Corporations kept profits – no wage increase
Purchasing Power is lost • Credit encouraged consumer spending • Americans fell further in debt buying products they cannot afford. • 1929 – Americans could not afford staples of life • Sales dropped and companies begin to fail. • The Great Depression ensues • Lasted well into the 1930s • Dramatically changed Americans lives & society
Spoke Diagram • Please add 3 spokes to your spoke diagram based off of the key factors that were discussed over slides E,F,G. Ex 2 Ex 1 Ex 3 Unequal Distribution of Wealth L