DO NOW Monday, November 4, 2013
100 likes | 243 Views
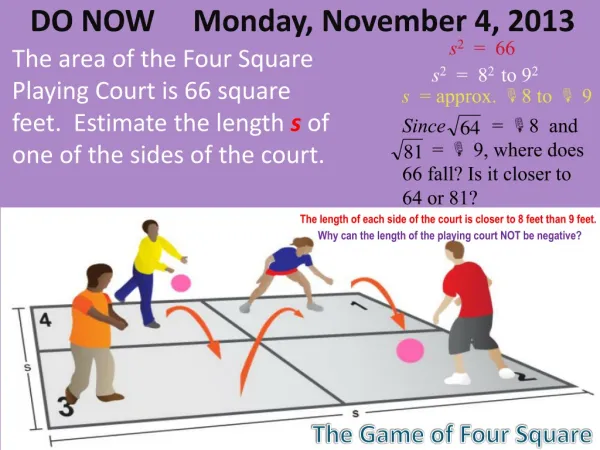
DO NOW Monday, November 4, 2013. s 2 = 66. The area of the Four Square Playing Court is 66 square feet. Estimate the length s of one of the sides of the court. s 2 = 8 2 to 9 2. s = approx. 8 to 9. Since = 8 and = 9, where does

DO NOW Monday, November 4, 2013
E N D
Presentation Transcript
DO NOW Monday, November 4, 2013 s2 = 66 The area of the Four Square Playing Court is 66 square feet. Estimate the length s of one of the sides of the court. s2 = 82 to 92 s = approx. 8 to 9 Since = 8 and = 9, where does 66 fall? Is it closer to 64 or 81? The length of each side of the court is closer to 8 feet than 9 feet. Why can the length of the playing court NOT be negative? The Game of Four Square
Monday, November 4, 2013 Name: ________________________ Per: __ Learning Objective What are we going to do? CFU We will solve and interpret1 problems using a Venn Diagram. Activate Prior Knowledge We can group the cards below into different categories based on certain qualities each has. Evaluate the nine cards below. How are they similar? How are they different? How can we place them into groups / sets? Students, you already know how to group terms into categories such as Equations, Expressions, etc. Make Connection 1explain (synonym) Vocabulary
Concept Development • A Venn Diagramis a collection of two or more sets2 of data (numbers, information, etc.) • Representing information using Venn Diagrams allow us to see similarities and differences . • Venn Diagrams are an easy way to show similarities and differences visually using a graphic organizer. CFU How many individual sets are shown in the Venn Diagram to the left? Explain what the darker blue region describes. Venn Diagrams How are 2-Dimensional Shapes different from 3-Dimensional Shapes? How are 2-Dimensional Shapes Similar to 3-Dimensional Shapes? 2 Collections of things (Numbers, Information, Data, etc.) Vocabulary 2-D 3-D
Skill Development/Guided Practice • A Venn Diagramcan compare information from two or more sets. • Typically, Venn Diagrams compare either two or three sets of data . • Areas where sets overlap show similarities, while areas that do not intersect show differences.. How is your data similar and how is it different? What is each question asking and how do I find the information needed to answer it? CFU Reading Venn Diagrams. 2 Identify what each circle describes (these are your sets being compared). Interpret the data contained in each set. Read each question carefully and determine what data is needed to answer. 1 2 3 3
Skill Development/Guided Practice (Continued) • A Venn Diagramcan compare information from two or more sets. • Typically, Venn Diagrams compare either two or three sets of data . • Areas where sets overlap show similarities, while areas that do not intersect show differences.. How can you tell the total number of all areas of the Venn Diagram? What is each question asking and how do I find the information needed to answer it? CFU Matching Venn Diagrams. 2 Identify what each set describes. Interpret the data contained in each set. Read each question carefully and determine which Venn Diagram states . 1 2 3 3
Relevance Is it possible that other languages are spoken that are not represented in the Venn Diagram? (Pair-Share) Where would you list other languages that are not in the three sets shown? (Pair-Share) CFU 32 8
Skill Closure Matching and Reading Venn Diagrams. Identify what each set describes. Interpret the data contained in each set. Read each question carefully and determine which Venn Diagram states . 1 2 How many people drank only water? How many people drank soda? How many people drank only soda? How many people drank both water and soda? How many people drank water? 3 Word Bank Word Bank Set Venn Diagram Collection Common Similarities Differences Summary Closure What did you learn today about Venn Diagrams? (Pair-Share) Use words from the word bank.
Periodic Review 1 x = 17 p = 14 225 169 36 144 225 36 144 169 Estimation Approximately where does fall on the number line to the right? Periodic Review 2 15 13 6 12 y = b = 1 24 36 35 -1 9 -7 16 1 3 3 2 -1 7 451 24
Independent Practice • A Venn Diagramcan compare information from two or more sets. • Typically, Venn Diagrams compare either two or three sets of data . • Areas where sets overlap show similarities, while areas that do not intersect show differences.. How is your data similar and how is it different? What is each question asking and how do I find the information needed to answer it? CFU Reading Venn Diagrams. 2 Identify what each circle describes (these are your sets being compared). Interpret the data contained in each set. Read each question carefully and determine what data is needed to answer. 1 2 3 3
Independent Practice • A Venn Diagramcan compare information from two or more sets. • Typically, Venn Diagrams compare either two or three sets of data . • Areas where sets overlap show similarities, while areas that do not intersect show differences.. How can you tell the total number of all areas of the Venn Diagram? What is each question asking and how do I find the information needed to answer it? CFU Matching Venn Diagrams. 2 Identify what each set describes. Interpret the data contained in each set. Read each question carefully and determine which Venn Diagram states . 1 2 3 3